
We can use a Chi-Square test to check if proportions are equal across several groups of data. The example here is of the proportion of enlisted men and women in the US armed forces. Does the proportion of men and women in the US armed forces differ by service?
The data is obtained from the Statisticbrain website and can be found at http://www.statisticbrain.com/demographics-of-active-duty-u-s-military/.
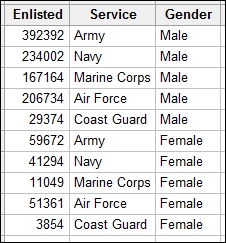
The following steps will compare the proportion of enlisted male and female personnel in the US armed services using a Chi-Square test:
- Go to the Stat menu, click on Tables, and select Cross Tabulation and Chi-Square.
- Enter Service in the field For rows: column.
- Enter Gender in the field For columns: column.
- Enter Enlisted in the field Frequencies are in: column.
- Select the Chi-Square… button.
- Check the options for Chi-square test, Expected cell counts, and Each cell's contribution to the Chi-Square statistics.
- Click on OK twice.
The Cross Tabulation and Chi-Square tools are a great way to build a table of frequencies. We have used rows and columns in this example, but we could also use layers to split the table by a third factor. The default view is to display the counts within the table.
The null hypothesis for this test is that the Chi-Square score is zero; the alternative is that it is not zero.
We can find the expected cell count for women in the services using this formula: (total number of females/total number of personnel) * number of personnel in that service.
The same can be run for the number of males in each service.
The contribution to Chi-Square for a cell is found from this formula: (Observed-Expected)^2/Expected.
Pearsons Chi-Square is the sum of the contributions.
Bar charts would be a great way to present the results of this Chi-Square test. Read about bar charts in Chapter 2, Tables and Graphs. Use Values from a table bar chart, One column of values and select the Stacked graph. Graph options can be used to show the percentages; set these options within columns that are at level 1.