
The clustering tools look for similarities or distances in the data to form groups of results. Cluster observations find groups among the rows of the data, while variables look to find groups among the columns.
For both Cluster Observations and Variables, we will investigate a dataset on car fuel efficiency. Cars are listed as observations and we will look to find groups among the different vehicles.
The following steps will cluster vehicle types together to identify similar vehicles that are identified by rows and then label the dendrogram with a column of vehicle and fuel type:
- Open the
mpg.mtwworksheet . - Go to the Calc menu and select Calculator….
- In Store result in variable:, enter the name of the new column as
Group. - In Expression:, enter the values as shown in the following screenshot. Then click on OK to create the
Groupcolumn.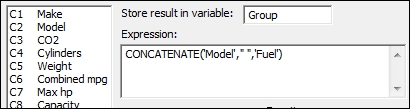
- Go to the Stat menu, click on Multivariate, and select Cluster Observations….
- Enter
CO2,Cylinders,Weight,Combined mpg,Max hp, andCapacityinto Variables or distance matrix:. - Check the to Show dendrogram box.
- Click on the Customize… button.
- In Case labels:, enter
Group. - Click on OK in each dialog box.
- Check the following dendrogram figure to identify the number of groups that may exist in the data:
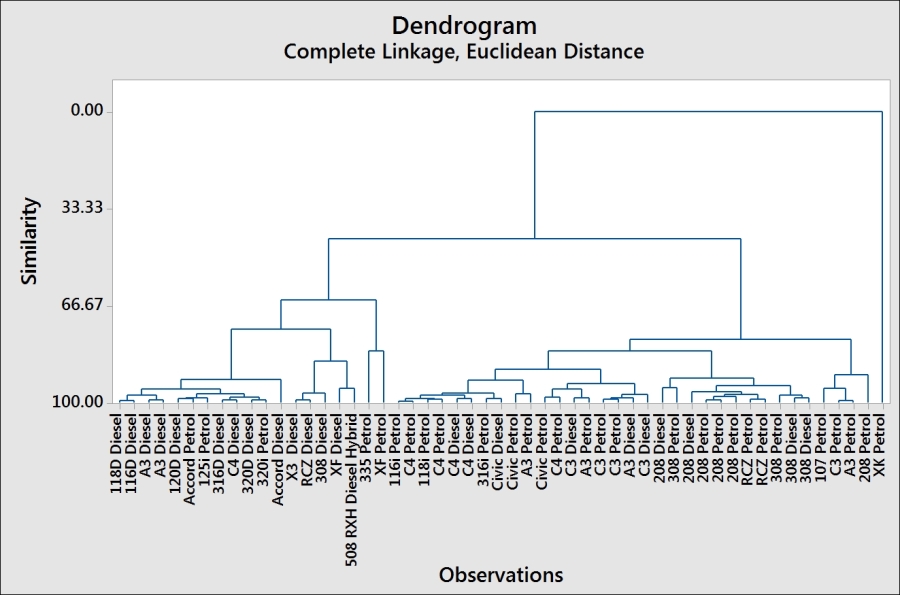
- From the chart, we may decide to investigate how observations are clustered together using a similarity of 90.
- Press Ctrl + E to return to the last dialog box.
- Choose the Specify Final Partition by Similarity level: option and enter
90. - Store the group membership by going to the Storage… option. Enter a column name as
Clusterswithin the Cluster membership column: section. - Click on Ok.
With the single linkage method used in this example, Minitab will try to find the first cluster by looking at the differences between pairs of observations. The pair with the minimum distance is joined. With the second step, we look to find the next minimum distance. At each step, we join clusters by looking at the minimum distance between an item in one cluster and a single item or another cluster.
While the single linkage method looks for the minimum distance between observations, there are other linkage methods that we can use in Minitab. These are averages, centroids, maximum distances between the pairs of observations between clusters, medians, and more.
We can also choose a distance measure to link clusters from the following measures:
- Euclidean: This is the square root of the sum of squared distances
- Pearson: This is the square root of the sum of the squared distances divided by the variances
- Manhattan: This is the sum of the absolute differences
- Square Euclidean: This is the sum of the squared distances
- Squared Pearson: This is the sum of the squared distances divided by the variances
By observing the dendrogram, we can visually identify clusters of observations, use a similarity level, or ask to find a fixed number of groups in the data. Here, we used a similarity of 90 to define clusters. This gives us six clusters in the cars dataset.
It is advised that we be careful in the interpretation of the clusters to ensure that they make sense. By investigating the other linkage methods, we can compare the groupings that are found and try and identify the grouping that makes the most sense.
The Case labels option from the Customize… option allows us to use a column to name the rows displayed on the dendrogram. If this was not used, we would just display the row names.
Different linkage methods can have different patterns and effects to watch out for. A single linkage, for example, can end up grouping the observations into long chains (as individual items can be close to each other) whereas the average-based methods can be influenced more by outliers in the data.