Cluster K-means is a nonhierarchical technique to cluster items into groups based on their distances from the group centroid. Minitab uses the MacQueens algorithm to identify groups.
Here, we will look at finding groups of tax revenues for the UK from April 2008 until June 2013 in the data. The value of * for row 49 onwards, next to the dates in the second column, indicates provisional data.
The values are in millions of pounds sterling. We might expect tax revenue patterns to exhibit a measure of seasonality. We will use cluster K-means as a way of grouping the months of the year. As this is expected to be based on the month within a quarter, we will initially set the clusters to three.
In the How it works… section, we will compare the identified clusters with the results of a PCA for this data.
The following steps will identify the observations into three groups within the data, based on their distances from the centroids group:
- Open the
Tax Revenue.MTWworksheet by using Open Worksheet… from the File menu. - Go to the Stat menu, click on Multivariate, and select Cluster K-Means….
- Enter all the columns from
C4 PAYEincome toC32 Child Benefitinto the Variables: section. - In Number of clusters:, enter 3.
- Check the Standardize variables option.
- Click on the Storage… button.
- In Cluster Membership column:, enter
Group. - Click on OK in each dialog box.
The output will generate tables to indicate the clusters and observations within each cluster. Minitab will create groups based on their average distance from centroids and maximum distances of centroids of each cluster.
It is useful to standardize the results in this example as the tax revenue has very different scales for each variable. Income-tax-based revenue has a much greater value and range than climate change levies.
By storing the cluster membership into a new column called Group, the worksheet will label each row 1, 2, or 3 in this column. To understand the implication of groupings in the data, compare the new column to the months in the second column. We should see that the group 123 is a repeating pattern. April is 1, May is 2, June is 3, then July is 1, and so on. April is the start of the second quarter of the year, May is the middle, and Jun is the end of the quarter.
In this example, we let the algorithm identify its own grouping in the data, and this is related to the exact month in a quarter. A more useful method is to provide a seed or starter group to identify the grouping in the data. To do this, we would need to use an indicator column to identify a group for an item in the worksheet.
To do this, create a column of zeroes and then enter a group number on known lines to seed the cluster K-means algorithm. The seed points form the basis of each group. The seed column needs to be the same length as the other columns in the study, hence the requirement to complete the column with.
The following steps will create a seed column that can be used with the tax revenue data:
- A column of zeroes can be quickly created using the Make Patterned Data tools and Simple Set of Numbers… from within the Calc menu.
- Name a column
Seedwithin the Store patterned data in: section. - Enter
0in the From first value: and To last value: boxes. In the Number of times to list the sequence: section, enter63. - Then in the worksheet, change the values of
0in the seed column to 1, 2, and 3 in rows 1, 2, and 3.
The final partitions found by cluster K-means will depend a lot on the specified initial conditions. Hence, the use of this tool is best when we have an idea of the number of groups we are looking for and some initial seed conditions to start each group.
As additional checks on the data, we can check the results by coding the months in the second column and using this column on the score plot from the principal components analysis. Use Text to Text… by navigating to the Data | Code menus. By completing the dialog box shown in the following screenshot, we will code the months to the start, middle, and end of a financial quarter:
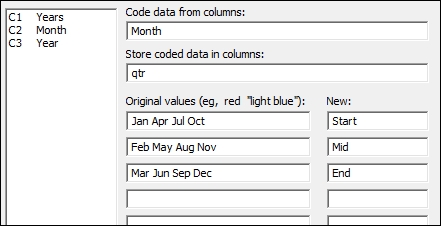
When comparing the coded values, we should see that they match the Group column identified in cluster K-means.
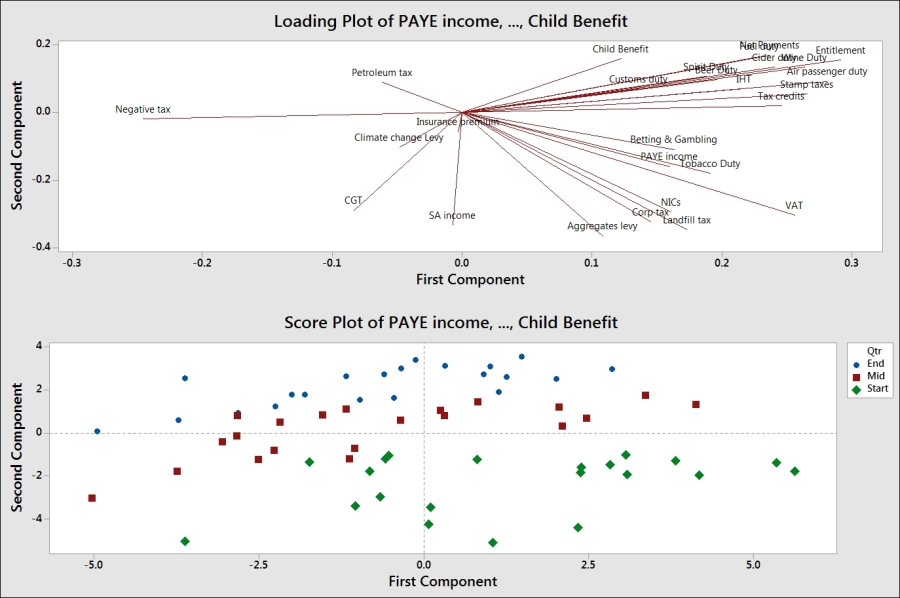
Next, use the Principal Components… analysis with loading and score plots from the Multivariate menu and enter columns C4 to C32 in the Variables: section.
Under the Graph… option, select the score plot and the loading plot and run the study.
To see the effect of the groups identified in cluster K-means, double-click on one of the data points on the score plot. Select the Groups tab and in the Categorical variables for grouping: section, enter either the Group column or the qtr column.
The resultant score plot should clearly separate the three stages in each quarter.