
The Assistant menu's tools also include a crossed Gage R&R. They offer a simpler dialog use and guidance with interpretation of the results in exchange for fewer options compared to the Stat menu tools.
Here, we will use the same data as in the crossed Gage R&R study earlier as a comparison with the crossed study within the Stat menu.
The data is on measuring fill volumes; we have two operators, 10 parts, and two replicates. We will use specifications of 14.25 and 15.75.
The crossed Gage study in the earlier recipe shows stacking a dataset that is set out in a format more typical to Excel. Rather than repeating these instructions, we will open the data in the worksheet Gage R&R stacked.mtw. This holds the worksheet ready for Minitab.
The following instructions will step through the Assistant menu to lead us to the Gage R&R:
- Open the worksheet
Gage R&R stacked.mtwby using Open Worksheet from the File menu. - Go to the Assistant menu and click on Measurement Systems Analysis (MSA).
- Follow the decision tree to the left, as shown in the following screenshot, for a data type of Measurement and an objective of Analyze data.
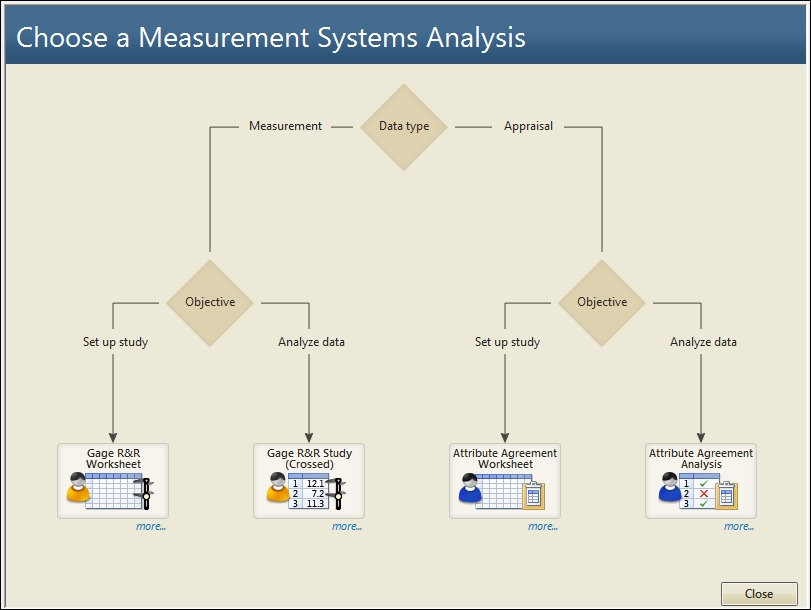
- Select Gage R&R Study (Crossed).
- Enter
Operatorin Operators. - Enter
Partsin Parts. - Enter
Measurein Measurements. - In the section for Process variation, choose the option to Estimate from parts in the study.
- Enter the Lower spec: as
14.25and the Upper spec: as15.75. - Click on OK.
The assistant Gage R&R offers an easier to use dialog box without all the options that are offered in the Gage R&R (Crossed) option in the Stat menu. This makes it easier to use and offer guidance on the reports. There are four report cards generated for the Gage R&R.
The Summary report will indicate if the measurement system can assess process performance and tolerance. Process performance is judged by historical process variation if this report is used, and percent study is judged by percent process or study variation if the historical variation is not entered.
The adequacy of the gage is judged by the AIAG guidelines as follows: less than 10 percent is ideal, 10 percent to 30 percent is marginally acceptable, and greater than 30 percent is unacceptable.
The assistant Gage R&R will only use the ANOVA method for the analysis, not the Xbar-R method.
For more control over what output is displayed or what options to select (for example, the Xbar-R method and the number of standard deviations for the study variation) we should use the Gage R&R tools from the Stat menu.
Like the crossed Gage R&R, the assistant will run an attribute agreement analysis. The attribute agreement analysis is shown in the next recipe.