
Using the data in the Pulse worksheet, we previously checked to see if the number of regular smokers in a group of students was different to a historical proportion of 0.25. We will use the 2 Proportions test to check if the proportion of regular smokers is different by gender.
Open the Pulse.mtw dataset from the Minitab Sample Data folder. The Smokes column has values of 1 or 2; 1 refers to students who smoke regularly and 2 refers to students who don't smoke regularly. The Sex column uses 1 for male and 2 for female.
The following steps will help us compare the proportion of smokers and nonsmokers between male and female students:
- Go to the Stat menu and then Basic Statistics and select 2 Proportions….
- Enter the Smokes column as Samples: and the Sex column as Sample IDs:.
- Click on OK.
The results will show Event as level 2 in the response column. 2 refers to the nonsmokers, the X values in the table indicate the count of nonsmokers, and the Sample p values indicate the proportion of nonsmokers in the group. The following screenshot indicates where this event is indicated:
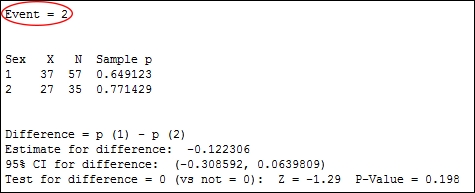
Event is alphabetically chosen as the last value by default. The preceding screenshot shows 2 as the event, that is, the nonsmokers. 65 percent of the male students were nonsmokers, compared to 77 percent of female students. If we coded the columns to text values as in the Using the 1 Proportion test recipe, Smokes - Does Not Smoke, then the Event would be Smokes.
The P-value is calculated from a standard normal approximation, which is the Z-score in the previous output. This can be inaccurate if there are less than 5 events or nonevents in either of the samples. Fisher's exact test is also calculated and can be used when the normal approximation is not valid.
The dialog can also accept data as summarized results or separate columns by changing the options available in the drop-down box.
The null hypothesis for the 2 Proportions test is p1-p2 = 0. The alternative for the two-sided test is p1-p2 ≠ 0.