
In the previous example, we ran a t-test to compare the population mean against a hypothesized value. The results of the t-test on the data entered showed us a mean of 0.255 with a standard deviation of 0.43. In this example, we will check the size of difference that a 1-Sample t-test using 15 samples and a standard deviation of 0.43 can detect with 80 percent or 90 percent power.
We will use the results of the mean, standard deviation, and the sample size from the Comparing the population mean to a target with a 1-Sample t-test recipe. We would like to know the type of difference that this test can observe.
The following steps will generate the size of effect that we could observe using 80 percent or 90 percent of the results in the previous recipe:
- Go to the Stat menu and select Power and Sample Size; it is last option in the menu.
- Then select 1-Sample t….
- In Sample sizes:, enter
15; in Power values:, enter0.8and0.9; and in Standard deviation:, enter0.43as shown in the following screenshot: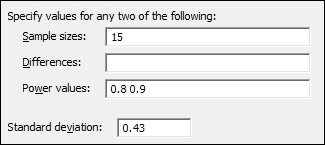
The result here indicates that if the population mean was really 0.3346 different from the target, we would be able to prove this difference 80 percent of the time we ran a 1-Sample t-test with 15 results. If the population was really 0.387 different from the hypothesized mean, this test would have a 90 percent chance of observing this difference.
By entering a difference that we would be interested in finding and a power value with which we would want to see that effect, we can obtain a suggested sample size.
Multiple values can be entered into the sample size, differences, or power values sections. They only need to be separated by a space. Power values should also be entered as a proportion rather than a percentage.