
The Assistant menu offers us an alternative route to a t-test. In general, the Assistant tools offer us a lot more guidance in both the use and interpretation of results than the Stat menu. The Assistant tools are designed to be more accessible and because of this, there are less options to choose from, compared to the equivalent tool in the Stat menu.
Here, we will use the same economic results as the 1-Sample t-test.
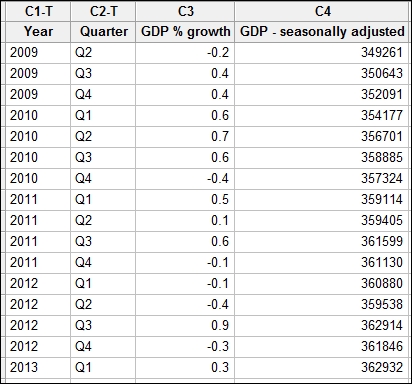
The data for this example is from the UK GDP figures from 2009 to 2013. Enter the data shown in the following screenshot into the worksheet. Alternatively, open the data UK GDP file1.mtw file.
The following steps will use the Assistant tools to run the 1-Sample t-test:
- In the Assistant menu, select Hypothesis Tests….
- From the screen that asks us what our objective is, select 1-Sample t from the Compare one sample with a target field.
- In the Data column: field, enter the percentage change results.
- Enter
0for the Target field. - Under What do you want to determine?, select Is the mean of '%change' different from 0.
- Click on OK.
The Assistant tool starts from a selection screen to guide us to a test. If we wanted more information on the presented choices, we would click on the top field under the first objective screen. Here, we would be presented with a decision tree to help us pick the right tool. Further guidance is found within each decision diamond.
By entering a difference that is of practical importance to us, the power of the test is calculated with the results and the suggested alternative sample sizes.
The output that is generated comprises several graphical report cards. The first page contains any warnings about the study. The second page contains diagnostic checks, a time series plot, and the power study. The last page contains the results of the t-test with an individual value plot, means, and confidence intervals, plus comments on whether we can conclude that the mean is different from the target or not.