
This chapter contains the following recipes:
- A capability and control chart report using the capability analysis sixpack
- Capability analysis for normally distributed data
- Capability analysis for nonnormal distributions
- Using a Box-Cox transformation for capability
- Using a Johnson transformation for capability
- Using the Assistant tool for short-run capability analysis
- Comparing the capability of two processes using the Assistant tool
- Creating an acceptance sampling plan for variable data
- Creating an acceptance sampling plan for attribute data
- Comparing a previously defined sampling plan – C = 0 plans
- Generating run charts
- Generating tolerance intervals for summarized data
- Datasets that do not transform or fit any distribution
This chapter looks at some of the quality tools found within Minitab. The majority of the functions used here are of the different capability analysis available. We will look at both normal and nonnormal distributions. Also, we take a look at a couple of the Assistant tools for capability as Assistant offers some great options for capability and presentation of data.
The final recipe in this chapter is more a note for a typical scenario that occurs with the data, namely, the problem that occurs when our data does not fit a distribution or a transformation comfortably.
It should be noted that capability analysis should only be run after we can establish that the process is stable. The results of capability, when a process is varying over time with trends or shifts in the mean or variation, will give an inaccurate estimate of capability. It should also be mentioned that the measurement systems are also expected to be verified as precise and accurate. For more on checking measurement systems, see Chapter 8, Measurement Systems Analysis. For control charts and checking for stability, see Chapter 6, Understanding Process Variation with Control Charts.
Along with the capability tools, we also look at acceptance sampling plans. These are shown for creating acceptance plans and a way to look at acceptance plans when the acceptance number is 0; these are known as C = 0 plans. The acceptance on 0 or C = 0 plans are popular in pharmaceutical applications.
For this chapter, the tools we are using are found in the Stat menu and Quality Tools as shown in the following screenshot. The relevant tools are found in the Capability Analysis option.
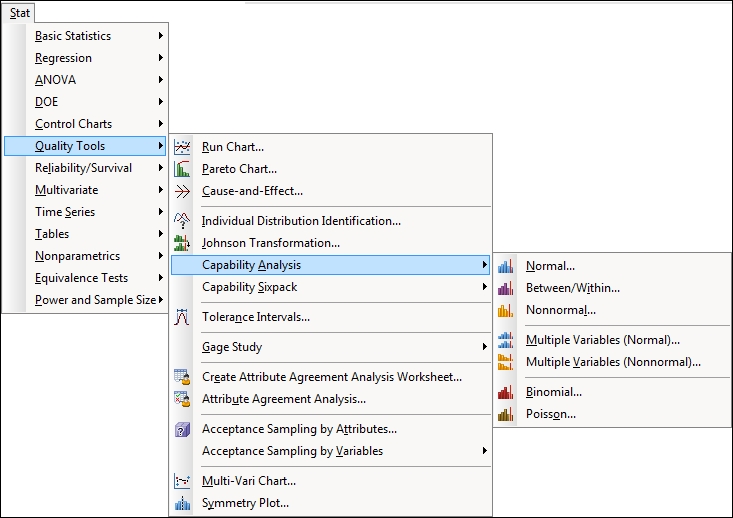
Gage R&R and other measurement systems analysis tools are also found in the Quality Tools menu. We will investigate these in the next chapter.