
Acceptance sampling is used to check a lot or a batch of product to identify if it is acceptable to the customer. Typically, a customer or a regulatory body will require a guarantee of quality.
The number of nonconforming product or nonconformities observed in a sample from the population can act as an indicator for the amount of problems in the whole lot. By observing fewer defects or defective items than the upper limit in the acceptance plan, we can state that the total of these in the population is likely to be less than the critical Acceptable Quality Level (AQL). If we observe more defects in the sample, then it is likely that the population does not meet the Rejectable Quality Level (RQL). In this recipe, we will find the number of samples and the critical distance to identify if a lot is acceptable.
Using the example of the syringe fill volumes, we have specifications of 14.25 ml and 15.75 ml. Each lot is of 5000 samples, and we will accept the lot if less than 0.1 percent is defective and reject if more than 1 percent is defective.
The following steps will generate a number of samples that should be collected from a population to verify the quality of that population:
- Navigate to Stat | Quality Tools | Acceptance Sampling by Variables and select Create/Compare.
- We will select Create a Sampling plan from the first drop-down list.
- Select the Units for quality levels to be used as Percent defective.
- Enter
0.1in the Acceptable quality level (AQL) field. - Enter
1in the Rejectable quality level (RQL or LTPD) field. - Enter the Lower spec as
14.25and the Upper spec as15.75. - Enter the Lot Size as
5000. - Click on OK.
By creating an acceptance plan, we generate a series of charts to compare the performance of the plan and a table of results in the session window. We should obtain the result in the session window as shown in the following screenshot:
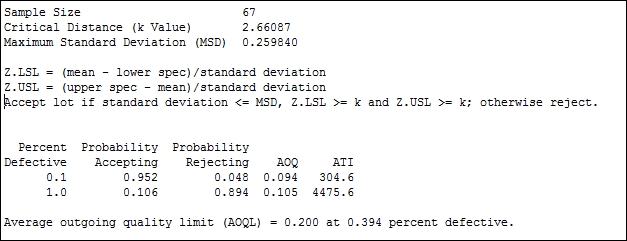
The sample size and critical distance are found to satisfy the condition that if the percentage defective in the population is really 0.1 percent defective there is less than a 5 percent chance of rejecting the lot. And if the population is really 1 percent defective, then we would have a 90 percent chance of rejecting the lot.
The plan will generate four charts to indicate the performance of the acceptance sampling plan. The operating characteristic curve shows the chance of accepting lots with a population percent of a specification between 0.1 percent and 1 percent.
The AOQ specifies the average outgoing quality of a lot with the stated percent defective. This figure is arrived at by assuming the reinspection and rework of rejected lots.
Average Total Inspection (ATI) is a figure that represents how many items, including the defective ones, are inspected on average. Even with lots at 0.1 percent defective, there will be 304.6 items inspected per batch on an average due to the 5 percent chance of rejecting a batch at 1 percent defective.
The critical distance k is the number of standard deviations from the mean to the closest specification limit. Here, If the specification limits are further than 2.66 standard deviations away from the mean then we can pass the lot.
The Accept/Reject Lot… tool for variable data can be used with the measured samples of an acceptance plan. This will return a reject or accept result based on the mean and standard deviation of the samples, and the critical distance of the plan.
We could compare a current acceptance sampling plan by using the Compare user defined sampling plan option. The output then evaluates the ability to accept or reject at the AQL and RQL values for the given number of samples and critical distance.
Acceptance sampling is often used with attribute data to identify if a binomial passes/fails or if the Poisson count of defects is acceptable.