
U-charts and c-charts are used for Poisson data rather than binomial. U is for defects per unit and c for counts. While similar to the P or NP charts, the control limits are based on a Poisson distribution.
In this recipe, we will type data for falls and beds occupied per month at a hospital into the worksheet. We will then use the u-chart to plot the number of falls in a hospital per occupied bed. The results are displayed as a per-unit figure.
This data is loosely based on an example discussed in the paper, Plotting basic control charts: tutorial notes for healthcare practitioners, by M.A. Mohammed, P. Worthington, and W. H. Woodall.
This paper is available at the following location:
http://medqi.bsd.uchicago.edu/documents/ControlchartsmohammedQSHC4_08.pdf
The data is given with monthly results in separate columns for ease of data entry. We will first transpose the data before plotting it on a u-chart. As the minimum number of occupied beds is within 75 percent of the maximum number occupied, we can use options to set the limits to use the mean value.
The following steps will transpose the worksheet before generating a u-chart.
- Go to the Data menu and click on Transpose Columns….
- Enter the results into the dialog box, as shown in the following screenshot:
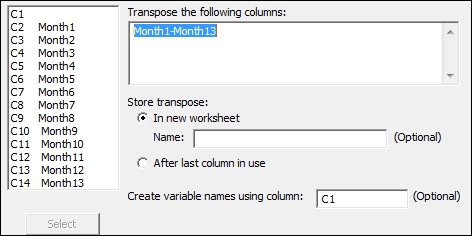
- Click on OK.
- Navigate to Stat | Control Charts | Attributes Charts and select the U… option.
- Enter the column for falls into the Variables: field.
- Enter the column for the occupied beds into the Subgroup sizes: field.
- Click on U Chart Options….
- Select the S Limits tab.
- In the When subgroup sizes are unequal, calculate control limits section, select the Assuming all subgroups have size: option and enter
904for the mean number of occupied beds. - Click on OK in each dialog box.
The control limits for the u-chart are based on the Poisson distribution and use the following formula:

The control limits are set by default at the value of +/- 3 around the mean. As with the P chart, values of the control limit that are less than zero will be fixed to 0.
By setting the option to use the mean number of beds occupied we fix the control limits to be constant. The default will generate a chart with control limits that vary with the subgroup size.
As long as the minimum subgroup size is greater than 75 percent of the maximum subgroup size it is reasonable to fix the control limits to be constant. This will not affect the per-unit figure.
The Display Descriptive Statistics option in the Basic statistics menu can be used to generate the mean, maximum and minimum values of the Beds Occupied column.
Four tests for special causes can be used with attribute control charts: tests 1, 2, 3, and 4. By default, only test 1 is selected. The other tests can be selected from within the u-chart options and the tab for tests.
Using the options for Minitab under the Tools menu, the default tests and rules for the tests can be chosen.
See the I-MR charts for more details of where to find these settings.