
C = 0 refers to an acceptance sampling plan where the acceptance number is zero. When samples are collected from the lot, observing any rejected items will cause the whole lot to be rejected. The C = 0 acceptance plans tend to need fewer samples than other acceptance plans. The offset for this is that lots are only reliably accepted when the defective levels are very close to 0.
Here, we will compare a previously defined plan, using Minitab, to tell us how the acceptance plan will behave. We can use the same tool to create an acceptance sampling plan and compare plans that we currently use. This can be useful to check the chance of acceptance or rejecting lots at different levels of quality. Changing the plan to a comparison also allows us to see the impact of using an acceptance level of 0.
The current plan inspects 230 samples and rejects the lot if any defectives are found. This is for an RQL or LTPD of 1 percent. No AQL is defined for this plan.
There is no data to be opened for this recipe. The current acceptance plans takes 230 samples from a lot. The lot is rejected if any defective items are found. We want to compare the performance of this plan for an AQL of 0.1 percent and an RQL of 1 percent.
The following steps will identify the chance of accepting or rejecting lots with an AQL of 0.1 percent and an RQL of 1 percent for 230 samples, with an acceptance value of 0:
- Navigate to Stat | Quality Tools and select Acceptance Sampling by Attributes.
- Enter details in the dialog box as shown in the following screenshot:
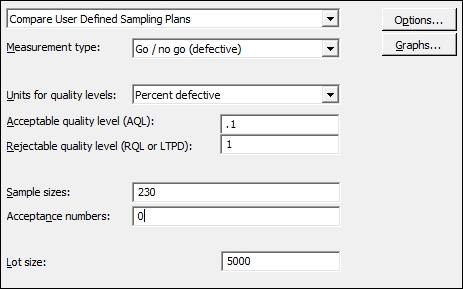
- Click on OK to run the study.
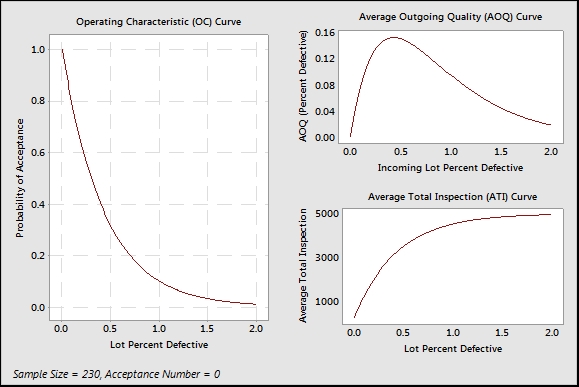
With C = 0 plans, the value of interest to define is the RQL or LTPD. LTPD is used to define the point at which we will reject lots. The outcome is that acceptable lots are the ones that tend to be 0 percent defective.
The graph of operating characteristics in the following screenshot will show a much steeper response with C = 0 plans than other acceptance plans. This shows that while we have a 90 percent chance of rejecting a lot with more than 1 percent defective, we roughly have only an 80 percent chance of accepting a lot with 0.1 percent defective. Notice that high levels of acceptance are only observed as the lot approaches 0 percent defective.
There can be confusion over the use of the terms AQL or RQL. In C= 0 plans, we would set the RQL or LTPD value. In many pharmaceutical applications, a plan is used, where anything above the RQL is rejected, but this does not imply that lots below the RQL are accepted but not to a high degree.
We can also use the Acceptance Sampling by Attributes dialog box to create a C = 0 sampling plan. We need to enter the RQL or LTPD as normal, but for the AQL, we need to enter a low value. The dialog box must have a value for the AQL and it must be above 0. Entering 0.0001 for the AQL though, will generate a C = 0 plan.