
In this recipe, in the pulse dataset, we will look at the proportion of students who smoke regularly. We want to check if the proportion is different now from a historical figure of 25 percent of students who smoke regularly. Additionally, we will convert the numeric values in the Smokes column to text. This step is not necessary for the proportions test but can be useful to display the results.
Open the Pulse.mtw dataset from the Minitab Sample Data folder. The column Smokes has values of 1 and 2; 1 refers to those who smoke regularly and 2 refers to those who don't smoke regularly.
The following steps will recode the values in the smokes column to categories of Smokes and Does not Smoke before checking to see if the proportion of smokers is different from the historical proportion of 0.25:
- Go to the Data menu, click on Code, and select Numeric to Text….
- Enter the data shown in the following screenshot into the dialog box:
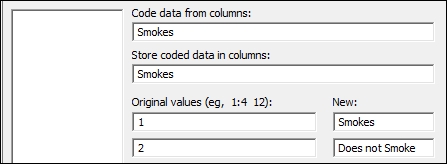
- Click on OK.
- Go to Stat and then Basic Statistics and select 1 Proportion….
- Enter the Smokes column as the Samples in columns:.
- Tick the option for Perform hypothesis test. Enter the Hypothesized proportion as
0.25. - Click on OK.
It is not essential to code the Smokes column from numeric values to text but this can be a useful step in the interpretation of the results. Steps 1 to 3 on coding data from numeric to text could be skipped if we want to go straight to the proportion test.
We have used the 1 Proportion test to count the frequency of observations in the Smokes column. It is also possible to use the 1 Proportion test with summarized results by entering the number of events and the number of trials.
The options for the 1 Proportion test can be used to change the confidence interval and choose between a one-sided or two-sided test.
The null hypothesis for this test is no different from the hypothesized proportion. The alternative hypothesis is that there is a difference. Here, we fail to reject the null hypothesis with a P-value of 0.278.
- The Graphically presenting the 1 Proportion test recipe
- The Using the Power and Sample Size tool for a 1 Proportion test recipe
- The Coding a numeric column to text values recipe in Chapter 1, Worksheet, Data Management, and the Calculator