
The Assistant menu first appeared in Minitab v16 to make the use of statistics and their interpretation more accessible. As such, this menu helps us select a control chart, before giving us some advice on our results. The Assistant menu does not offer all the control charts that are found under the Stat menu; it offers us only the most commonly used ones.
We will not look at any data but we will step through the decisions offered by the assistant in selecting a chart. Try the steps with your own data. The steps here follow the choices for an Xbar-R chart. This is to illustrate the choices given at each step of the Assistant menu.
The following steps will guide us through the Assistant tool decision tree to an Xbar-R chart:
- Go to the Assistant menu and select Control Charts….
- From the decision tree, select the top decision diamond Data type as shown in the following screenshot:
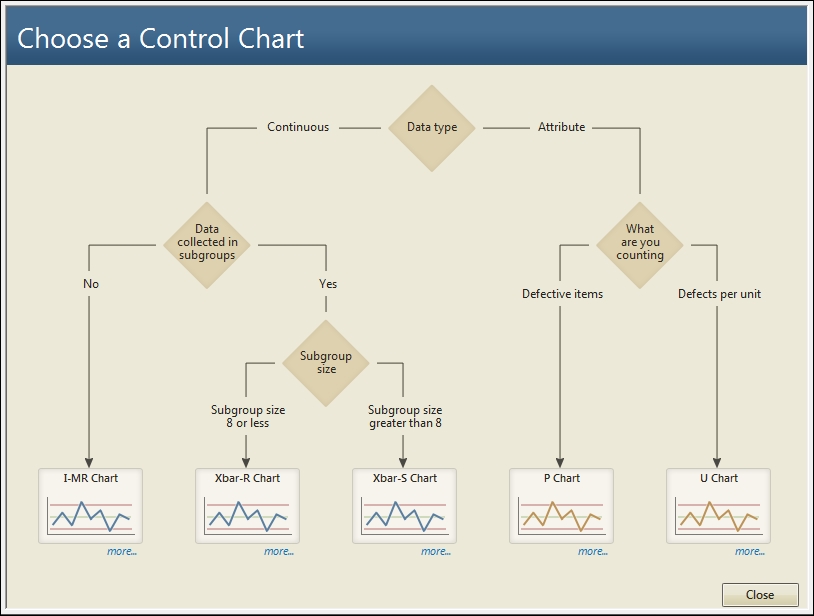
- Read the description about the data type choice and then click on Back.
- Read the description for Data collected in Subgroups then, click on Back to continue.
- Click on the more… label beneath Xbar-R Chart.
- We are presented with guidelines on collecting data for an Xbar-R chart and guidelines on using the chart. Select the section about collecting data in rational subgroups.
- After reading the guidelines, click on the Back button and select an appropriate chart.
- If you have data to be used with this recipe, enter the column and subgroup size.
- Under Control limits and center line, choose from Estimate from the data or Use known values.
- Click on OK to generate the reports.
The Assistant tool control charts will generate three report cards. The first report card will inform us about stability, the amount of data, and check for correlated data in the response. The second page will present the control chart, highlighting out of control points. The third page is a summary report with comments. This is shown in the following screenshot:
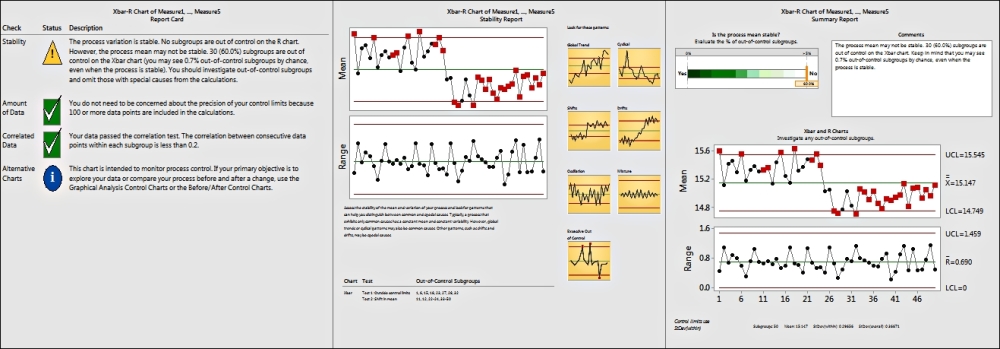
Each page gives us useful information, helping us build conclusions about the study.
All the assistant tools present us with a simpler-to-use dialog box to make it easier to run the study. They also give us guidance to help direct us to the correct tool to be used.
To make the use of the tools and interpretation of the output easier, Minitab does not have all the options available under the Stat menu. If we wanted to change the scale on the axis from an index or subgroup number to a date column, we would need to use the control charts in the Stat menu.
Not all tests for special causes are used. The Assistant will use Test 1, which is one point more than three standard deviations from the center line. Test 2 is nine points in a row on one side of the center line and Test 7 is 15 points in a row that are within +/- 1 standard deviation. For ease of use and interpretation of the results, we cannot change these rules. If we wanted to specify other tests for special causes or change the values used, we would need to go back to the control charts under the Stat menu.
Minitab can be a powerful aid for many users and is excellent for presentations to any audience, because of its assistant tools and the clarity with which it presents data. It is worth pointing out that although the Assistant menu provides a very quick and powerful start to using control charts, it does not have as many options as the Stat menu control charts. More advanced use of control charts can only be run from the Stat menu.
As an example, the Assistant tool will allow us to stage control charts from the Before/After Control Charts tool; if we wish to plot more than two stages, we need to use the control charts in the Stat menu.