
In this recipe, we will generate a custom layout of graphs. We will convert the previous recipe's Exec file into a Global macro and place all the charts on one page.
Global macros are similar to Exec files in that they look at the worksheet for the datasets. Like Exec files, they will use column names or references to identify the data to be used.
A benefit of Global macros over Execs is the ability to specify control statements such as DO and IF.
We will edit the report.MTB file generated in the previous example to place the histogram, probability, and time series plot into a single graphical layout. We will also edit the time series chart, add specification limits, and adjust the color and type of the reference line.
Open the Macro Data.MTW worksheet in Minitab and open the Exec file created in the previous recipe or the catch-up report.MTB file in Notepad.
The following steps will convert the Exec file created in the previous recipe into a Global macro. We will also place the graphs into a single graph page:
- In the
Report.MTBExec file, addGMACROto the top line in Notepad and as a second line, addGLAYOUT. - On the last line, add
ENDMACROso the macro looks like the following screenshot: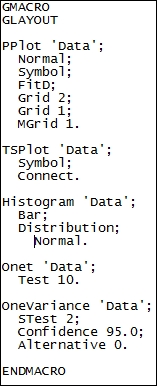
- Save the file in the macro directory with the name
Glayout.mac. - Press Ctrl + L to bring up the command-line editor. Enter the
%glayoutcommand and click on the Submit command. - Select the time series plot that the macro generated and right-click on the chart. From the right-click menu, go to Add and then select Add Reference Lines….
- In the Show reference lines at Y values: section, enter
12.5and click on OK. - Double-click on the reference line that is generated and change the line to a Custom type. Select a dashed line, a red color, and make the size of the line 2.
- Click on OK.
- Double-click on the label of 12.5 on the reference line.
- Change the Text: value to
USLand click on OK. - Go to the Editor menu and select the Copy Command Language option.
The Editor menu is context specific and will only show options that are relevant to the selected window. If the Copy Command Language option is not available, left-click on the chart and go back to the Editor menu.
Return to the macro in Notepad.
Delete the text for the time series plot. This should start with
TSPlot Data;and continue to the lineConnect;.Paste the copied commands into the section where the old
TSPlotcommand was. The command for the time series plot should now look like the following screenshot: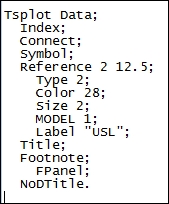
- To start a graph layout, enter
Layoutbefore thePPlotprobability plot command. - To finish the graph layout, enter
Endlayoutafter theHistogramcommand. - The graphs will need to be positioned on the layout page. For the
PPlotcommand, add theFigure 0 0.5 0 0.5;line as a subcommand. - For a histogram, add the
Figure 0.5 1 0 0.5;command-line. - For the time series plot, add
Figure 0 1 0.5 1;to ensure that the macro looks similar to the following screenshot: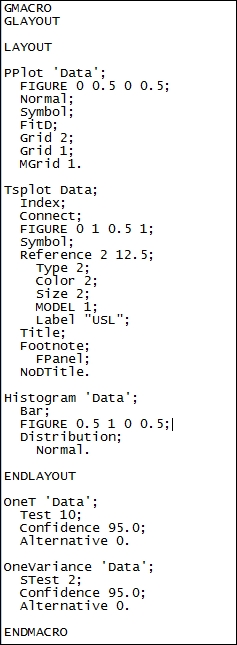
- Save the macro and test it to see if it works by going back to Minitab.
- Press Ctrl + L to open the command-line editor and enter
%glayoutand click on Submit Commands to run the macro.
Global macros use the GMacro header to identify whether they are Global macros. They also require the second line to be a name for the macro. Finally, macros must finish with the EndMacro command.
The macro's name is relevant only if several macros are used in the same file; for an example, see the Local macros with subcommands, submacros, and control statements recipe. The name of the macro is used to call that macro. To invoke a macro saved in the same file, we would use the Call Macroname command. If we are invoking a macro saved as a separate file, we would use the %Macroname command.
The copy command language functionality is an excellent method to edit charts visually and then obtain the text of those commands to use them in a macro.
Copy command language is a function that works only for the updating graphs in Minitab. This includes only the charts that we create from the Graph menu and the control charts. Most graphs created from the Stat menu do not update and have fewer subcommands. The Figure subcommand that we have used here, for instance, is only available for updating charts.
For a list of the subcommands that can be used by charts in either the Stat or the Graph menu, see the Help section and the Alphabetical command list, as discussed in the Introduction section.
The command and subcommand structure is defined by the use of full stops and semicolons. A full stop is used to end a command and a semicolon continues the command on the next line with a new subcommand. Any command that is only run on one line does not need the full stop to end the command. The following is an example of such a command line:
Plot C1*C2
If we were to include a regression fit to the scatterplot, the command would then need to be as follows:
Plot C1*C2;
Regress.
The Figure commands in this example used a semicolon to continue the subcommands. If the Figure commands are the last line of the command, they should be followed by a full stop.
Subcommands do not have any requirement to be placed in a specific order. Figure could be entered as the first or the last subcommand, or anywhere in between. Although, it must be noted that subcommands of subcommands must be included in the relevant section, as shown in the following screenshot:
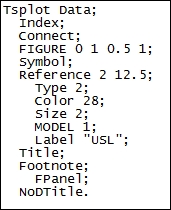
The reference subcommand for the time series plot places the reference line on the y axis, and the subcommands, such as Type, Color, and Size, all detail properties of that line. If Type does not follow the reference section, the Tsplot command will generate an error.
In the preceding code, Index, Connect, Symbol, and Reference could be entered in any order. Type, Color, Size, Model, and Label refer to the Reference subcommand and must appear with a reference.
The Layout command has two parts. Layout starts a graphical layout; any new chart that is created will be held waiting until the Endlayout command is given. All graphs created between those two commands are placed on the same page. If we do not position the graphs with the Figure subcommand, they would all be placed on top of each other. The Figure command defines the page position in the following way:
Figure X1 X2 Y1 Y2
Here, 0 0 0 0 defines the bottom-left corner of the chart and 1 1 1 1 is the top-right corner.
In general, spaces, tabs, and capitalization do not make any difference to how the macro runs. The commands are not case sensitive and while spaces are used to separate values as in Figure X1 X2 Y1 Y2 or Reference Axis Value, if we included two or more spaces, it would not affect the macro. The preceding time series plot code could remove all the leading spaces on each line and would work exactly the same as if it had been entered with spacing.
The commands that we copy across from the history folder or from Copy Command Language automatically space out subcommands. This is not essential for Minitab to understand the macro. It is convenient for us to identify subcommands while creating the macro. Similarly, it is recommended that we space out the commands in a Do loop or an If statement to ensure ease of reading the macro, when using control statements later.
Spaces are used to separate items and are only essential to pay attention to when used with functions such as greater than or equal to. This is entered as >=, with a space between the two, which will recognize it as separate functions.
A fiddly method of overlaying different charts is to use the layout to drop all the charts on one page. But as graph and figure regions on the charts are shaded, all but the first chart must be set to use no fill; otherwise, the last graph hides all the previous graphs. The graphs are placed in sequence of first to last and back to front. This is a tricky overlay method as care must be taken to position the axes of the data regions correctly.
The command language that is outputted to the history folder includes the full command text. Minitab only really needs to use the first four letters of any command. We could use a command of Histogram or Hist and both will run the same function.