
In this recipe, we will return to the topic of atmospheric pressure data. The data was obtained from the Climactic Research Unit. We will look at the atmospheric pressure recorded at the Gibraltar weather station. The test for equal variances will be used to check for differences in variance by month.
As with the data for the pressure difference used in the example, using the one-way ANOVA with unstacked columns' missing values is coded as -10. We will recode these to *. We will also need to stack the data before checking for differences in variation between the months.
Either open the file nao_gib.dat using the Open Worksheet command in Minitab or copy the data to Minitab from the NAO website. If opening the worksheet, set the file type to *.dat. Then use the Options file to set the Variable Names option to None and the Field Definition option to Free Format.
This nao_gib.dat file is also available on the Packt Publishing website.
The following steps will recode the value -10 to * and then stack the results before running a test for equal variance:
- Name the columns
C1toC14asYear,Jan,Feb,Mar,Apr,May,Jun,Jul,Aug,Sep,Oct,Nov,Dec,Annual. - Next, go to the Editor menu and click on Replace. Enter
-10in the Find what: field and in Replace with:, enter*. Click on Replace All. - Navigate to Data | Stack, and click on Stack columns.
- Select the month columns to stack the data by highlighting them and clicking on the Select button. In the Store stacked data in: field, enter the name for the New worksheet field as
Stacked Data. The dialog should appear as shown in the following screenshot: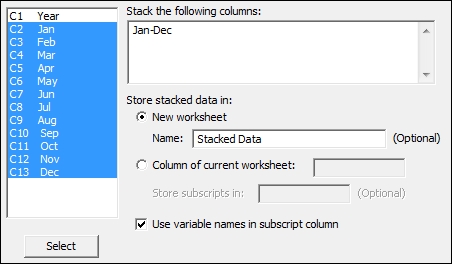
- Name the datasets in the new worksheet: column 1 as
Monthand column 2 asPressure. - Navigate to Stat | ANOVA and then click on Test for Equal Variances.
- Enter
Pressurein the Response field. - Enter
Monthin the Factors field. - Click on OK.
We could also have used the data without stacking the results. In Minitab v17, we can choose between the data in separate columns or in stacked ones. If we are using a previous version, we need to use the stack data command to put the results into one column.
The stack data commands will quickly create one column with all the numeric responses and a subscript column. Here, this subscript column identifies the month based on the column names of the unstacked data.
As stacked columns will not keep the information about a year in the new worksheet, there are two options to ensure that we keep this information. Use Stack Blocks of Columns or alternatively, we could create a new column for the year using the calculator tools of Make Patterned Data.
The results that we have generated plot the standard deviations of pressure for each month. They also include a confidence interval for the value of the population standard deviation—sigma. The degree of overlap between confidence intervals can give us an indication of how similar sigma is between categories. Note that it is not always the case that intervals which overlap the standard deviation of another category are similar.
On the right-hand side of the chart, we obtain the results of Bartlett's test and Levene's test. We will use the p-value for Bartlett's test when we expect each category to be distributed normally. Levene's test is not as sensitive to departures from a normal distribution and may be used for any continuous distribution. The results of Levene's test do not provide as accurate a figure for the p-value when the data is normal.
The Assistant option can also be used to run a standard deviations test. This can accept results as stacked or unstacked. The assistant output will give only the p-value for Levene's test, and it can be used only for one factor.
- The Using a one-way ANOVA with unstacked columns recipe
- The Using Assistant to run a one-way ANOVA recipe
- The Stacking several columns together recipe in Chapter 1, Worksheet, Data Management, and the Calculator
- The Stacking blocks of columns at the same time recipe in Chapter 1, Worksheet, Data Management, and the Calculator