
The Assistant tools will also run a one-way ANOVA. This provides a simpler route to generate the test and is presented as a series of graphical report pages.
For this recipe, we will compare the different mean times between failures of pressure sensors. The response is the number of weeks in service; the category is the failure mode of the circuit. The dataset we will open is circuit.mtw and is one of the example datasets that are installed with Minitab.
The following steps will run a one-way ANOVA and display the graphical reports:
- Go to the File menu and click on Open Worksheet.
- Click on the button for Look in Minitab Sample Data folder.
- Open the
circuit.mtwfile. - Go to the Assistant menu and then click on Hypothesis tests.
- From the Compare more than two samples heading, select One-Way ANOVA.
- From the drop-down box, make sure that the choice for data is selected as Y data are in one column, X values are in another column.
- In Y data column:, enter
Weeks. - In X values column:, enter
Failure. - Click on OK.
The assistant tools are a great way to obtain guidance on the test to run and the results of that test. They give the user a simpler dialog box by limiting the options available.
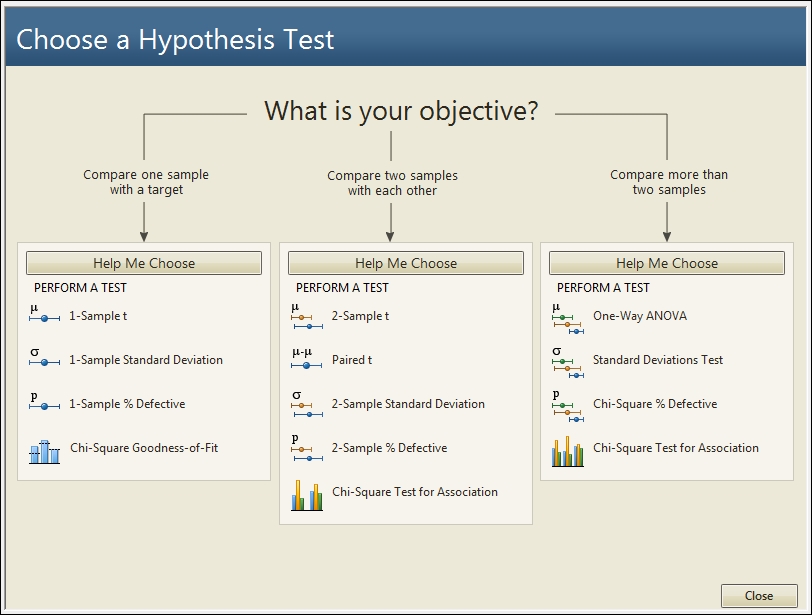
We can select a tool directly from the objective's screen or use the Help Me Choose option. The following screenshot shows the three objectives that we can select. By clicking on the Compare more than two samples title, we are taken to a decision tree to choose between One-Way ANOVA, Standard Deviations Test, or Chi-Square Test for Association:
The results from the one-way ANOVA will generate four graphical report pages.
The first page is the report card; here, we will find information or warnings about outliers, normality, and sample size. This will also inform us if the test has enough power to detect the difference that can be specified in the dialog power.
The second page is a power report of the study. When entering a value for the difference between the means, then we would obtain the power for that difference; this page will also provide alternative sample sizes or the differences that can be detected for a given power value.
The third page is a diagnostic report on the results. Time series plots are shown for each level, and outliers will be highlighted in red. The distribution of the results in each level will also be given as boxplots, individual value plots, or histograms. The type of chart that is displayed depends on the number of levels and the number of subgroups.
The last page is the summary report. This shows the p-value of the ANOVA. To help make the interpretation of the results easier, the null hypothesis is rephrased as the question. Do the means differ? The results of the p-value are plotted on a decision bar underneath. A means comparison chart is plotted to help identify the means that differ from each other, and comments are completed for us as well.
It is worth noting that the Assistant menu uses Welch's one-way ANOVA. Welch's method provides a correction for unequal variances across groups. It is used in the Assistant menu to provide a more conservative estimate of the p-value.