
For this recipe we will analyze the results of a crossed Gage R&R study. The data is initially in a format that we may typically find in an Excel worksheet. In the first column, we have Operator, in the second one we have Trial, and columns C3 to C12 have the measurements on each part. This format is mentioned in the AIAG manual on measurement systems analysis. These instructions will show us how to convert this tabular form into a preferred format for Minitab.
The third row contains the mean result for Helen, the seventh row contains the mean for Robert. The fourth and eight rows contain the ranges of each operator. This data has already been imported from Excel; for more on opening data in Excel, see Chapter 2, Tables and Graphs.
We will initially remove the rows of Means and Ranges and then stack the data. After stacking the data, we will recreate the column for operator names. Then, we will run Gage R&R Study (Crossed).
The specifications of 14.25 and 15.75 will also be entered into the study to generate percent tolerance and probabilities of misclassification.
The following instructions take a table of results and format them into columns to analyze the columns with the Gage R&R Study (Crossed) option:
- Open the worksheet
Gage R&R.mtwby using Open Worksheet from the File menu. - Go to the Data menu and click on Delete Rows.
- In Rows to delete, enter
3 4 7 8to delete the rows of the means and ranges. - In the section Columns from which to delete these rows, select all the columns in the worksheet.
- Click on OK.
- Navigate to Data | Stack and click on Columns.
- In the section Stack the following columns:, only enter the columns for the part numbers. The selection can be made easier by selecting columns
C3toC12. Then click on the Select button to move the columns across together as shown in the following screenshot: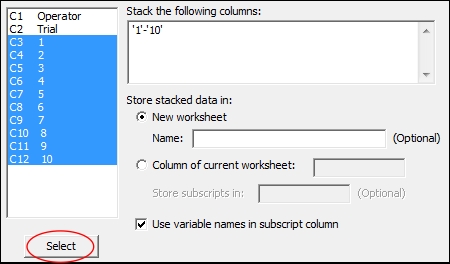
- In the section Name under New worksheet, enter
Stacked Data. - Click on OK.
- In the new worksheet, name column
C1asPartsand columnC2asMeasure. - Navigate to Calc | Make Patterned Data and click on Text Values….
- Enter data in the dialog box as shown in the following screenshot:
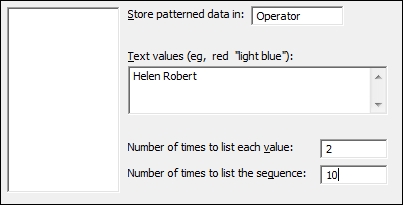
- Click on OK to create the
Operatorcolumn. - Navigate to Stat | Quality Tools | Gage Study and click on Gage R&R Study (Crossed).
- Enter
Partsin the section Part numbers. - Enter
Operatorsin the section Operators. - Enter
Measurein the section Measurement data. - Click on the Options button.
- Enter the Lower spec as
14.25. - Enter the Upper spec as
15.75. - Check the Box Display probabilities of misclassification.
- Click on OK in each dialog box.
Steps 1 to 12 are used to prepare the worksheet as the format is initially in a tabular form. They are useful for anyone importing their data from other sources.
The delete rows command is used to remove the rows of means and ranges to avoid including these in the calculations later. Rows can also be deleted by right-clicking the row number to highlight the entire row and clicking on Delete in the drop-down menu that appears.
We used the stack columns command, but this cannot stack the operator alongside the part numbers. The Stack Blocks of Columns command can stack the part numbers and the operators in one step, but will only allow eight sets of data to be stacked in the dialog box. Here we have 10 sets of data that need to be stacked.
To recreate the information on Operator, we use the Make Patterned Data tools. These are great for expanding information into a column. When the measurements are stacked, we know that there are two results for each Operator: the first and the second measurements on a sample. We list each value twice to state an operator twice in a row. Then, we repeat the pattern of Helen Helen Robert Robert for the 10 parts in the study.
These steps would not be needed if the data had been entered in the worksheet as described in the the Creating a Gage R&R worksheet recipe.
The output of the Gage R&R uses the ANOVA method as the default method of analysis. Studies previously calculated by hand use the Xbar and R method as this is a simpler technique than calculating sums of squares. Xbar and R calculations will not find interaction terms in the results whereas the ANOVA method will.
Entering specifications into Options, we calculate the percent tolerance. This could be entered as a lower and/or upper specification or just a tolerance interval. Using the limits rather than an interval allows the calculation of probabilities of misclassification. These are found by comparing the variation of the process and the measurement system to the specifications. Joint probabilities give the probability of identifying bad parts as good and good parts as bad. Conditional probability is the probability of misclassifying a part that is known to be out of spec as good or known to be in spec as bad.
Joint probability is based on not knowing if the tested sample is in spec or not, whereas conditional probability says that we know the tested part is good or bad.
When historical standard deviations are used, the Gage study will generate percent process to compare the measurement system variation to the historical process variation.
The value of the study variation used in Minitab's Gage R&R is given as 6 standard deviations. Those familiar with Gage studies from past AIAG manuals may be used to a value of 5.15 standard deviations. The third edition of the AIAG manual on measurement systems analysis uses the value of 6 standard deviations rather than 5.15. The default value used in Minitab has been updated to reflect this change. Options… allows us to change the value of study variation if we need to.
One final option that can be useful is the inclusion of confidence intervals. These are switched on from the Conf int… subdialog box. One-sided or two-sided intervals can be selected here.
The Stack Blocks of Columns command, when used with the session commands, will allow more than just the eight sets of data that the dialog box allows. For more on session commands and macros, see Chapter 11, Macro Writing.
How many parts and operators should we use in a Gage study? The automotive guidelines recommend at least 10 parts and three operators with two replicates to give a total of 60 results. Ideally, the goal of the parts in the study is to represent the variation in the process. If a historical standard deviation is unknown, then it is suggested that more samples are collected. For more information on number of samples, refer to the discussion of this topic on the Minitab website. This information can be found in the answers database at http://www.minitab.com/en-US/support/documentation/answers/NumberPartsOperatorsGageRR.pdf.
The Assistant tool for Gage R&R also contains advice on the number of samples. Here, the recommended number of samples to estimate the process variation is between 15 to 35.
For more information on the Assistant tools, see the Minitab knowledgebase and answer ID 2613 at
http://it.minitab.com/en-us/support/answers/answer.aspx?id=2613
If the study has no operators and the measurement system is part of an automated system, then we can run a crossed Gage R&R without operators. We only need to enter the column for parts and measurements.
Studies can also be more complicated; comparison between measurement devices with operators can also be investigated. With additional factors, we can analyze the results by using an expanded Gage R&R study. This is covered later in this chapter.
- The Stacking several columns together recipe in Chapter 1, Worksheet, Data Management, and the Calculator
- The Stacking blocks of columns at the same time recipe in Chapter 1, Worksheet, Data Management, and the Calculator
- The Expanding a Gage study with extra factors recipe
- The Using the Assistant tool for Gage R&R recipe