
Here, we will look at checking the accuracy of a measurement device over its range of measurements. The worksheet Gage Linearity has a study with five known reference samples, each measured 12 times. The actual result and the measured value are used to estimate the bias or linearity of the measurement device.
There is a historical process variation of two units that will be used to assess the size of the bias and linearity to the process variation.
The following instructions will check the accuracy for a range of standard samples:
- Open the worksheet
Gage Linearity.mtwby using the Open Worksheet… option from the File menu. - Navigate to Stat | Quality Tools | Gage Study and click on Gage Linearity and Bias Study.
- Enter
Partin the Part numbers field. - Enter
Referencein the Reference values field. - Enter
Resultin the Measurement data field. - Enter the Process variation as
2. - Click on OK to run the study.
The AIAG suggests a linearity and bias study should comprise five reference parts with 12 measurements. This is to gather information on the mean bias for each reference value.
The results will plot the bias, difference between the measured value and the actual value on the chart on the left along with the mean bias at each reference value and a regression line. The plotted result is shown in the following screenshot:
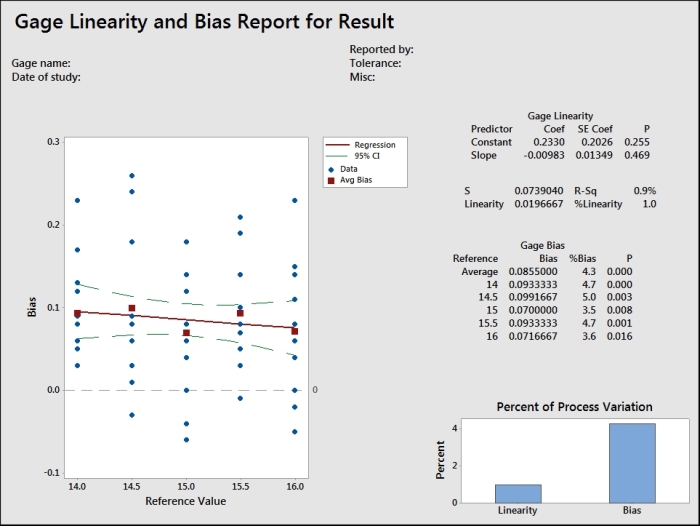
If the confidence interval of the regression line completely encloses the zero line, then our results can be judged as accurate. Should the confidence intervals not include the zero line completely, it could include a horizontal line so that we have a flat bias. Sloped lines would indicate that the measurement system has a changing bias across the results.
The output also includes P values on the bias and slope. The null hypothesis for these are 0 bias and 0 slope respectively.
Quadratic problems with accuracy can also show up in this style of study; however, they can only be visually assessed.