
Discriminant analysis is a technique to classify observations into different groups. Here, we will use a linear discriminant function to predict the outcome of the battles in World War II. The example for this data is based on the study Discriminant Analysis: A Case Study of a War Dataset by Dr Nikolaos V. Karadimmas, M. Chalikias, G Kaimakais, and M Adam. This can be found at the following link for more details:
http://www.academia.edu/193503/Discriminant_Analysis_-_a_case_study_of_a_war_data_set
Wikipedia was used as a source to obtain the data in the worksheet. We should verify the correctness of this before drawing conclusions from the dataset.
Here, we will obtain the troop and tank ratios for each battle from the calculator before constructing the linear discriminant function as a method to predict the outcome of the battle.
Enter the results into the worksheet, as shown in the following screenshot:
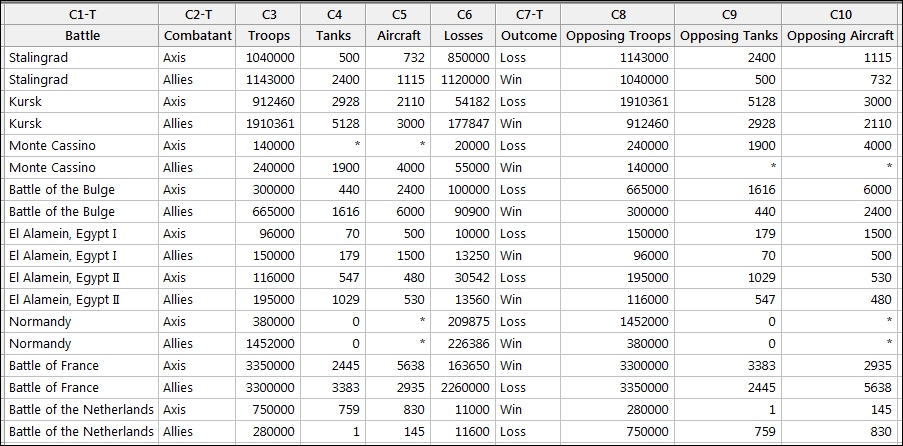
These figures are also included in the World War II.MTW worksheet.
The following steps will generate columns of Troop and Tank ratios for the results before finding a linear discriminant function to identify the outcome of a battle:
- Go to the Calc menu and select Calculator….
- In Store result in variable:, enter
Troop Ratio. - In Expression:, enter
'Troops'/'Opposing troops'. - Click on OK to create the column.
- Press Ctrl + E to return to the previous dialog box.
- Press F3 to reset the dialog box to blank settings.
- In Store result in variable:, enter
Tank Ratio. - In Expression:, enter
'Tanks'/'Opposing Tanks'. - Click on OK to create the column.
- Go to the Stat menu, click on Multivariate, and select Discriminant Analysis….
- Enter
Outcomein Groups:. - In Predictors:, enter
Troop RatioandTank Ratio. - Click on OK to run the study.
The results in the session window will give us a summary of classification, as shown in the following screenshot:.
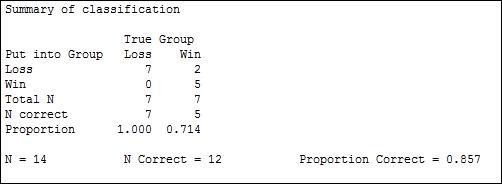
Only 14 of the 18 results are used, as four lines have missing values for the tank ratio. The summary table indicates the correctly identified number. Out of this study, two results were misclassified. The session window will indicate that these are row 2 and row 15.
The linear discriminant function is generated to classify the group. This is shown as follows:
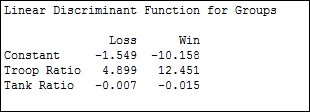
We have two linear expressions. One for loss and one for win. We can construct a column in the worksheet called Loss and use the following expression:
Then we can create a Win column and use the following expression:
We would classify a result as a loss if the Loss column has a greater value than the Win column. If Win is greater, the result is classified as a win.
The linear discriminant function uses the assumption that the covariance matrices are equal for all groups. If the covariance matrices are not equal for all groups, then the quadratic discriminant function is more appropriate.
The discriminant analysis can often show overly optimistic values when predicting the dataset used. To check how good the analysis really is, we could split the dataset into two parts. One part is used as a training dataset and the other part is used to predict the group membership by using the discriminant function from the training dataset. An alternative is to use cross validation. Cross validation will leave one result out of the study at each round and try and predict the group when the result is left out.
We may want to use discriminant analysis to predict group membership for new observations. If we had a set troop number and tank number for battles where the outcome was unknown, then we would enter this in Options….
The discriminant analysis tool allows the use of prior probabilities and entries for columns to predict group membership from within the Options… section.