We use multiple correspondence analyses on tables of three or more categorical variables. This expands the study of a simple correspondence analysis from the two-way table to more variables. One downside of this technique is the loss of how rows and columns relate.
The data that we will look at is based on a study of students and their gender—whether they live in urban, suburban, or rural locations—and their goals to be popular, that is, being good at sports or getting good grades.
This is a simplified dataset that is taken from the original located at DASL. The full dataset can be found at the following location:
http://lib.stat.cmu.edu/DASL/Datafiles/PopularKids.html
We will tally the results of the columns to observe the value order of the columns and then we need to create a categorical list of the labels for each item in the factor columns. We will list these figures in the fourth column in the correct value order before running the multiple correspondence analysis.
The following steps use Tally to identify the categories in the tables and then use them to identify student priorities:
- Open the
MCorrespondance.MTWworksheet. - Go to Stat, click on Tables, and select Tally Individual Variables….
- Enter the columns
Gender,Urban/Rural, andGoalsin Variables:. - Click on OK.

- Return to the worksheet and name the fourth column as
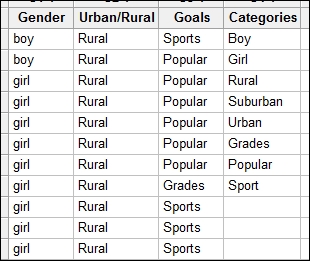
Categories. - In the fourth column, enter the categories of the factors as shown in the following screenshot, where categories must be listed in the order shown in the tally:
- Go to the Stat menu, click on Multivariate, and select Multiple Correspondence analysis….
- In the Categorical names: section, enter the columns of
Gender,Urban/Rural, andGoals. - In the Category names: section, enter
Categories. - Select the Results… button and check the option for Burt table.
- Click on OK.
- Click on the Graphs… button and check the Display column plot option.
- Click on OK in each dialog box.
As Minitab does not take the names of the categories inside the columns, we need to specify them in a separate column. Hence, we create the fourth column as Categories, in the study to specify the names in the dialog box.
Tally can be a useful step to check the order of the text as seen by Minitab. This is alphabetical by default. We can adjust this order by right-clicking on a text column and selecting Value Order… from the Column section.
The output of the multiple correspondence analysis will generate tables of the indicator matrix's analysis. Inertia and proportion can help identify the usefulness of the study. Column contributions are also generated to identify the effect of each of the categories.
Each of the levels of a factor are converted into an Indicator column internally by the multiple correspondence analysis commands. Hence, the levels of boy, girl, rural, urban and so on, are referred to as columns.
We could have used a worksheet generated as a set of indicator variables directly. Each column would be a 0 1 column that indicates the presence of that value. To create indicator columns very quickly, use the Make Indicator Variables… tool in the Calc menu.
Entering the Gender column into Make Indicator Variables will create a column for boy and a column for girl.
As with simple correspondence analysis, we could include supplementary data.
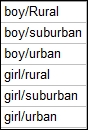
We could also return to a two-way table structure in a worksheet of three or more categories using the Combine… option from Simple Correspondence Analysis. This would allow us to define how the variables are combined and whether they relate to rows or columns.
We cross the variables of gender(boy/girl) and urban/rural(Rural/SubUrban/Urban); this will create a combined variable in the order that is shown in the following screenshot: