
Exec macros are the simplest form of macros that can be written in Minitab. They are only session commands that are saved in a text file. Exec files must use the *.MTB file extension.
Here, we will use data in the Macro data.mtw worksheet to create an Exec file to automate the running of several charts. If we regularly work from a set of data in the same format each week or each month, then we can use a simple Exec such as this one to run all the commands that we would use in the menus.
The Exec file will generate probability, histogram, and time series plots and will then run 1 sample t-test and a 1 Variance test on the data.
We will run the tools from the menus in Minitab in sequence, before using the commands from the history folder to save them as an Exec file.
Open the Macro Data.MTW worksheet by going to the File menu and selecting Open worksheet….
The following instructions will use the history folder to build a simple Exec file to generate a series of graphs:
- Go to the Graph menu and select Probability Plot….
- Select the Single plot.
- Enter
Datain the Graph variables: section. - Click on OK.
- Go to the Graph menu and select Time Series Plot….
- Select the Simple chart.
- Enter
Datain the Series: section. - Click on OK.
- Go to the Graph menu and select Histogram….
- Select the With Fit and Groups option.
- Enter
Datain the Graph Variables: section. - Click on OK.
- Navigate to Stat | Basic statistics and select 1-sample t-test.
- Enter
Datain the One or more samples, each in a column: section. - Check the option for Perform hypothesis test and enter
10for Hypothesized mean:. - Click on OK.
- Navigate to Stat | Basic statistics and select 1 Variance….
- Enter
Datain the One or more samples, each in a column: section. - Check the option for Perform hypothesis test.
- Enter
2in Value:. - Click on OK.
- Go to the history folder, which is the yellow icon on the project manager toolbar, as shown in the following screenshot:

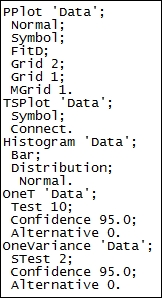
- Highlight the commands from PPlot to the end of the OneVariance test, as shown in the following screenshot:
- Right-click on the selected commands and go to Save As….
- Name the file as
Reportand choose the Save as type: option asExec Files – ANSI (*.MTB). - Navigate to the macro directory and click on Save.
- To run the macro, go to the File menu and select Other Files and Run an Exec….
- Click on Select File.
- Navigate to the macro folder and select the
Report.mtbfile. - Click on Open to run the Exec file.
The Exec file is only a text file and can be edited by opening it in Notepad or any other text editor. Exec files can be created by writing or pasting the commands directly into Notepad as well as saving them directly from the history folder. The ANSI denomination on the file is short for American National Standards Institute. Typically, saving the Exec file as an ANSI formatted text should avoid any issues with compatibility.
Minitab will run commands in the order that they are saved in the Exec file. In this manner, they can be created very quickly and simply by using the menus to generate the desired output and then selecting the commands from the history folder.
After following the previous steps, the Exec will always look for a column labeled Data to generate the output. If a worksheet does not contain a column of this name, the Exec file will not work. As an alternative, we can use the column references, C, and the column number to point to a specific column.
The Number of times to execute: field allows an iterative Exec to be run. This can be useful as a simple way to run a simulation. If we want to estimate a parameter with a Monte Carlo simulation, we can use the number of times the file is executed as a way of taking multiple sample points.
There are several commands that can be added to help an output in Minitab. The XWORD command will output the charts and session window to Word, and XPPOINT will output to PowerPoint. Adding either of these to the end of the Exec file will send everything in the session window and all charts directly into either application.
Graphs can be sent into the Report pad within Minitab by use of the GMANAGER command with an APPEND subcommand. This works only for graphs in the project and not for results in the session window.
We can use the Exec file to split the worksheet, subset the worksheet, and more. These data tools generate new worksheets. The macro will continue running within the active worksheet after splitting or subsetting it. Should we need to swap to a different worksheet, then the Worksheet command used with the worksheet name can be used to swap between worksheets in a project. Constants, columns, and matrices remain unique to a worksheet; storing a constant in one worksheet will not be available in a second worksheet.