
In the previous recipe, the macro used a fixed specification limit of 12.5. Here, we will add commands to ask for the specification and then group the points on the time series plot. This grouping is used to color points based on whether they are inside or outside the specification.
Allowing input from the session window can be helpful when running a macro. This can be a great way to add some flexibility to the macro. This uses the Set command to ask for input from the session window.
We will need to open the macro from the previous recipe or the catch-up macro, Glayout.mac. Open this file in Notepad. Next, open the Macro Data.MTW worksheet.
The following steps will add a command to ask for input from the session window in Minitab. This is then used to identify if the data is above or below this number.
- Rename the
GLayoutmacro and save the file asGSession.mac. - Add the following lines after the macro name and before the
Layoutcommand: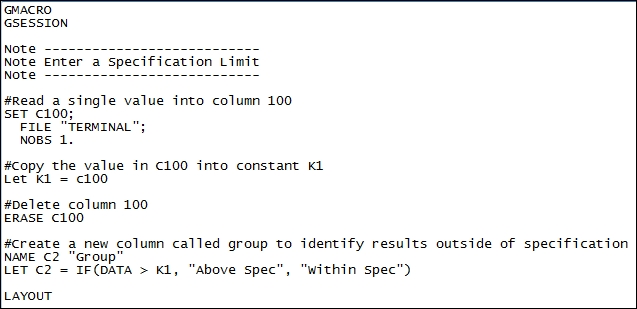
- Find the
Tsplotcommand in the macro. Change theReference 2 12.5;line toReference 2 K1;. - Add a
Legendsubcommand and a grouping symbol to the time series plot as shown in the following screenshot: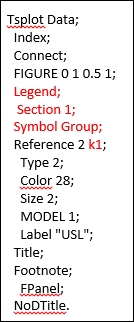
- Save the macro and return to Minitab.
- Press Ctrl + L to bring up the command-line editor and type
%GSessionand click on Submit Commands to run the macro.
The Set command can be used to open data within ASCII files. Using the filename as a terminal, it specifies the session window as the data source. We could use a FORMAT subcommand with Set. The Format subcommand is used to set the format of the data; F specifies numeric values, A specifies the alphanumeric values, and DT specifies the date/time; more information on the format items can be found in Minitab's help section.
F5 tells Minitab to look for a five-digit number. Characters are included in that amount; for example, 12.5 is four characters. We could use the F3.1 format and it would read in three values, the last value being the first decimal place. For example, entering 123 with the F3.1 format would give us 12.3.
When the Format subcommand is not used, the Set command will only read in numeric values.
The last NObs subcommand is the number of observations. By fixing this to 1, we only look for one data entry. When the Set command is run, the session window will be given more focus and the prompt session will change to Data >; entering a value and pressing Enter will continue the macro.
The Set command can only read into columns, not constants. Because of this, we had to read into a column in the worksheet. It can be a safe practice to save the new data into columns that are away from the rest of the data to avoid any overwrites in new worksheets while storing data. The Let command then takes the value from C100 and enters this into the K1 constant. If there was more than one value in C100, we would specify the row with this syntax: C100[1].
We have used the # symbol to enter comments into the macro. Any text following a # is ignored by the macro. This can be in the line of the code as well.
We manually entered new subcommands to the time series plot command to group the symbols by the new group column. Alternatively, we could have made the changes on the graph and copied the command language. This is detailed in the previous recipe.
The Let command uses an IF statement as a calculator function. See the Calculator – using an if statement recipe in Chapter 1, Worksheet, Data Management, and the Calculator, to on how to calculate if statements. This is not the same as the IF session command that will be used in the Local macros with subcommands, submacros, and control statements recipe.
The Note command is a quick way to output notes into the session window. Any text that follows a note is printed to the session window. The Print command has a similar functionality but can also print columns or constants. The Print "Hello world" command will output text to the session window within the double quotes. The Print K1 command will print the value in the K1 constant.
The reference line has been updated in this activity to take user input from the session window. Alternatively, we could place a reference line from the mean of the data. To do this, we would need to store the mean in a constant and use this constant for the reference line. The Column Statistics… tools under the Calc menu can be used to store values directly into constants.
Most of the Stat menu tools also offer us the ability to store values in the worksheet. These will be stored in the columns of the worksheet. This way, we can use many of the generated values and report them out on a new graphical page.
We may want the value that is generated by a function from a capability analysis such as Cpk, but may not want to generate the typical set of charts. In those cases, we can use the BRIEF command.
The BRIEF command can be used to limit or expand the output from results in Minitab. BRIEF 0 is no output; BRIEF 2 is the default level of output. The level of BRIEF relates to the options available in the results of many tools.
Some tools also have the NOCHART subcommand to suppress the graphical output.
- The Calculator – using an if statement recipe in Chapter 1, Worksheet, Data Management, and the Calculator
- The Local macros with subcommands, submacros, and control statements recipe