
The layout tool is a clever way to bring several graphs together onto one graph page. This can be a powerful way of presenting data or making comparisons.
The only requirement to run this example is to have a Minitab session open with at least two graphs available. The greater the amount of charts, the better this example.
Let's get started with the steps to bring several graphs together on to one graph page:
- Make a graph an active window by selecting it with a left-click.
- Go to the Editor menu, which will show you the editing options for graphs and select the Layout Tool… option.
- Select a graph from the left-hand list, and double-click on it or click on the right arrow to move the chart across into the layout.
- If you have more charts to add, select them from the list and double-click on them to add.
- Once all the required graphs are in the layout, click on Finish to create the new page.
Selected graphs will be moved into the section with the blue border. The following screenshot shows us that the next graph that is added would be placed in the lower-left section:
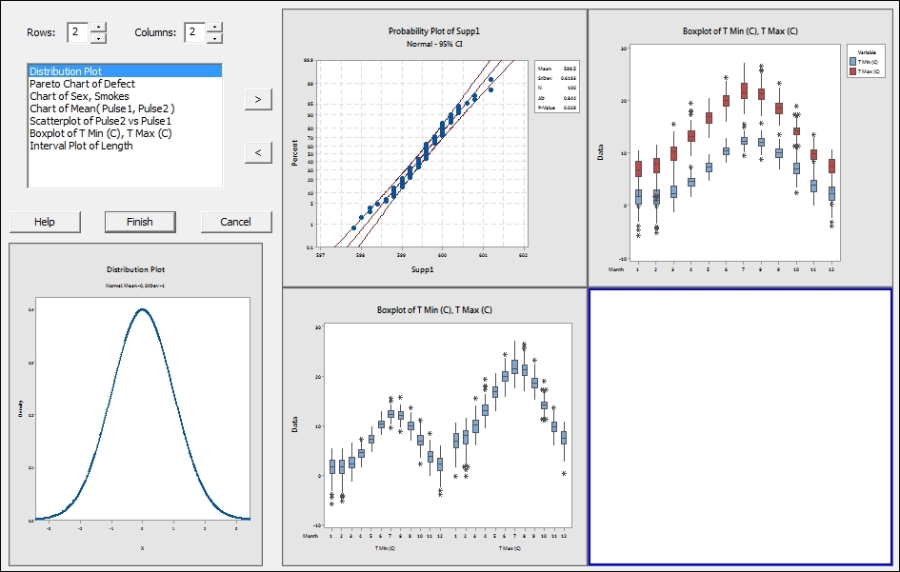
Charts already added to the layout can be orientated on the page by dragging them into the position.
The page is very flexible to change its set up. Notice in the screenshot the top-left corner provides a section for rows and columns. The default value for rows and columns is 2 creating a 2 x 2 panel of graphs. The values here can be changed from 1 to 9 allowing any combination of graphs up to a 9 x 9 layout.
Clicking on the Finish button fixes the charts in position and creates the page.