
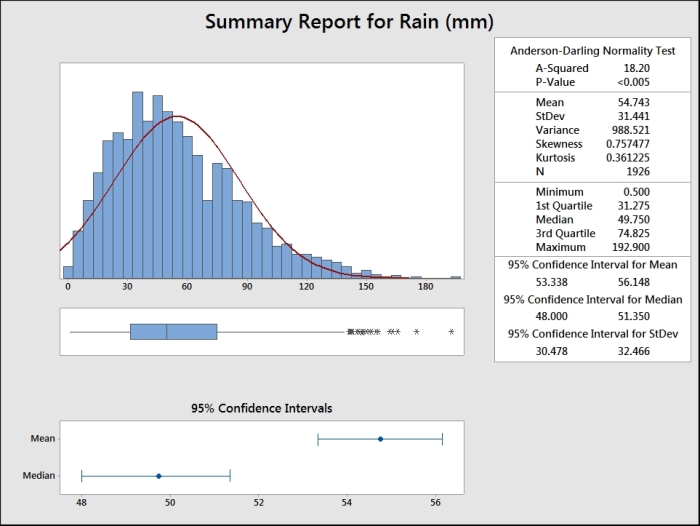
The Graphical Summary… tool is a quick way of producing an overview of a column of data. The following example shows us the output comprising a histogram, the Anderson-Darling test for normality, mean, standard deviation, and more.
Here, we will use the data from the Oxford weather station and produce a summary of the amount of rainfall in mm for each month, for all the results from 1853 onwards.
We will use the data from the Oxford weather station in this example. This data is from the Met Office website and can be found at http://www.metoffice.gov.uk/climate/uk/stationdata/. Select the Oxford station.
The data is made available in the Oxford Weather.txt file; this preserves the format from the website. This data is also available in the Minitab Oxford weather (cleaned).mtw file, and using this worksheet correctly imports itself into Minitab for us.
The following steps will import the weather station's data and then produce a summary of rainfall seen in each month from 1853 to 2013:
- Follow the previously mentioned link to the Met Office weather station website.
- Choose the Oxford (Oxford 1853-) station.
- In your web browser, save the file as a text file.
- In Minitab, go to File and select Open Worksheet….
- Change Files of type to Text (*.txt).
- Select the file that we have just saved or select the provided
Oxford Weather.txtfile. - Click on the Preview… button to see how the data will be imported. Notice that the data starts on line 8 and the variable names on row 6. All the data appears in one column.
- Click on OK and select the Options… button.
- In the Variable Names section, select Use row: and enter
6. - For the First Row of Data section, select Use row: and enter
8. - Set the Field Definition option to Free format.
- Click on OK in the Open Worksheet dialog box and then click on Open.
- Go to the Stat menu, then Basic Statistics and then click on Graphical Summary….
- In the dialog box, enter the column for rainfall amount as the Variables: field, and the column for month into the By Variables field.
- Click on OK.
The columns in Variables populate the summary statistics and the optional selection of By variables (optional) allows us to split a set of data into separate summaries. Using the month as By variables (optional) creates a summary for each month. The following screenshot shows us the results for July:
If we want to view the results from only one month, say July, instead of generating a summary for all months, we can use the Split Worksheet… or Subset Worksheet… tools. These can be used to generate new datasets using the results contained within a single month.