
In the first activity, we will use the one-way ANOVA to check the differences between population means across several groups of data. We will be using atmospheric data for the North Atlantic Oscillation (NAO). The NAO is an important climatic phenomenon that affects the North Atlantic. Variations in the NAO affect the weather across Europe. Measurements of the pressure difference between the northern weather station in Iceland and more southerly stations are an important measure of this phenomenon.
Here, we will use the one-way ANOVA to investigate the effect of the pressure difference across months.
This data was obtained from the Climactic Research Unit and is located at http://www.cru.uea.ac.uk/cru/data/nao/; this can be opened in Minitab by opening the DAT file using Open Worksheet or by can copying and pasting the results directly. Within the DAT file, missing data is indicated as -99. These will need to be converted to a * symbol for Minitab to recognize as missing values.
We will open the data into Minitab, identify missing values in the worksheet, and then use the one-way ANOVA to study the pressure difference by month.
Either open the nao.dat file using the Open Worksheet option in Minitab or copy the data to Minitab from the NAO website. On opening the worksheet, set the file type to *.dat. Then use the Options file to set Variable Names to None and Field Definition to Free format.
This file is available on the Packt Publishing website.
The following steps will recode the value -99 as missing data, and then study the effect of a month of the year on pressure difference:
- With the data in Minitab, we need to rename the columns. Enter the column names for
C1toC14asYear,Jan,Feb,Mar,Apr,May,Jun,Jul,Aug,Sep,Oct,Nov,Dec,Annual. - Next, go to the Editor menu and click on Replace. Enter
-99.99in the section for Find what: and in the Replace with: section, enter*. Click on Replace All. - Navigate to Stat | ANOVA and then click on One-Way….
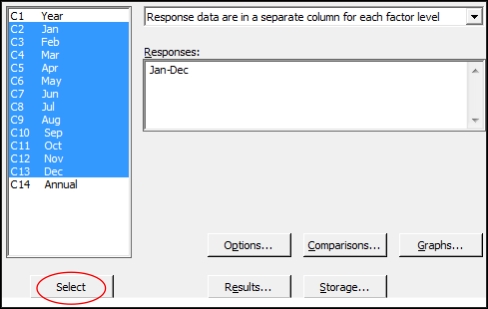
- From the drop-down selection, change the option for the data setup to Response data are in a separate column for each factor level.
- Select the columns for the monthly results and enter Responses: as shown in the following screenshot. They can be entered in one group by highlighting the columns in the left-hand selection and then clicking on the Select button.
- Click on the Graphs button; choose Boxplots of data and Three in one residual plots.
- Click on OK in each dialog box.
Rather than needing to stack the columns of data, we can use the unstacked one-way ANOVA. The same results could be obtained using the general linear model but we would need to stack the data first. For more on stacking columns, see the Stacking several columns together recipe in Chapter 1, Worksheet, Data Management, and the Calculator.
The one-way ANOVA options have changed slightly in Minitab v17, compared to previous releases. The separate dialog boxes for unstacked or stacked data have been combined into one selection. The one-way ANOVA can also run Welch's test now. Under Options, there is a tick box to select Assume equal variances. When this is unselected, we would run Welch's ANOVA.
Another change for Minitab v17 is the move of the character graph that displays means and confidence intervals into an interval plot.
Multiple columns can be selected in the dialog boxes by left-clicking and selecting the top item and dragging it down in the list. Using Shift or Ctrl for selection will work too. When selecting multiple columns, they will be identified in the column list as C1-C5—where the dash indicates the range of columns between the first and last.
The comparison options allow the use of Tukey's, Fisher's, Dunnett's, Hsu's multiple comparisons. Also included is the Games-Howell comparison for when we cannot assume equal variances.
The output from the one-way ANOVA will generate the sum of square values for the months, F-statistics, and the p-value for the test. The null hypothesis for the one-way ANOVA means that there is no difference between means or has no effect on the variation.
The three-in-one residual plots that are generated allow us to check the assumptions of normality of the residuals and homoscedasticity, equal variance, or the residual error. If the residuals show unequal variances, then the p-value of the one-way ANOVA test can be inaccurate. When we cannot assume equal variances, we can choose to use Welch's ANOVA as indicated previously.
The Assistant menu also provides a one-way ANOVA test. This will always use Welch's ANOVA for unequal variance.
Residuals over time are not produced for unstacked data as the results may not follow a logical time order. With the results of pressure difference, we do have a time component and this should be checked with time series plots to look for any patterns in the results.
- The Stacking several columns together recipe in Chapter 1, Worksheet, Data Management, and the Calculator
- The Testing for equal variances recipe
- The Calculating power for the one-way ANOVA recipe
- The Using Assistant to run a one-way ANOVA recipe