
Here, we will look at the number of samples needed in a one-way ANOVA to detect differences of 1, 2, or 3 standard deviations in size for 80 or 90 percent power. When we do not have a historical standard deviation, we can use a figure of one in the dialog box. The differences are then referred to as multiples of the standard deviation.
The following steps will generate the sample sizes required to find differences of 1, 2, or 3 standard deviations with at least 80 or 90 percent power:
- Navigate to Stat | Power and Sample Size. Then click on One Way ANOVA.
- In the Number of levels: field, enter
12. - In Values of the maximum difference between means:, enter
1 2 3. - In Power values:, enter
.8 .9. - In Standard deviation:, enter
1. The dialog box should look like the following screenshot: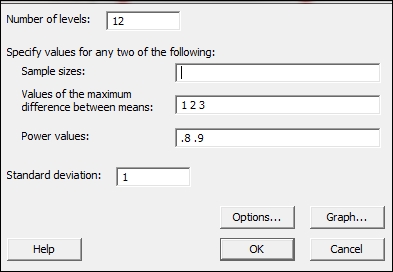
- Click on OK.
Most typically, we would use this tool to assess the power of results where we have a known standard deviation. This could then be run after a study to verify if the results have enough power to identify a difference of interest for us.
When the historical standard deviation is unknown to us and we are planning on samples to take, we can refer to the differences as a ratio of the standard deviations. We should note that we will obtain the same sample sizes when using a standard deviation of 2 and differences of 2, 4, and 6.
The results here indicate that in a study with 12 groups, we need 10 samples per group to have an 80 percent chance of identifying a difference of a two-standard deviation between the means of the levels. If this is a study looking at differences across 12 months of the year, we would need 10 samples from each month to achieve the power stated previously.
As a general note on the entry of values into dialogs, Minitab uses spaces to identify separate values. Entering the differences as 1 2 3 with a space will tell the software to find sample sizes for each difference. Entering multiple power values will give us sample sizes for each difference and power. This is presented on a power curve and in the session window.