
The critical F-statistic is the point at which the F-statistic has a proportion in the tails of the distribution equal to the decision level of the test. Usually, these figures are referred to in tables. Such a table can be found in the Index of Applied Linear Statistical Models, Fourth Edition, by Neter, Kutner, Wasserman, and Nachtsheim.
Here we will use a significance level of 0.05, and find the critical F-statistic for 8 df in the numerator and 33 df in the denominator. These figures come from the example of Teacher Pay in the analysis of covariance in the model with the included interactions. We will derive this graphically from the probability distribution plot and from the probability distributions from the Calc menu.
The following steps will graphically plot the F-distribution shading the right-hand tail for an area of 0.05:
- Go to the Graph menu and select Probability distribution plot.
- Select the View probability option.
- Change the distribution to F and complete the dialog as shown in the following screenshot:
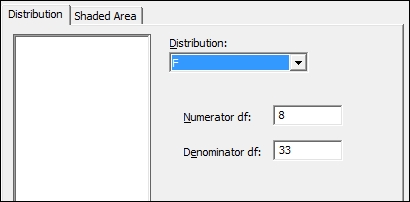
- Click on the tab for Shaded Area.
- Make sure that the choice for Probability is selected and Right Tail is chosen from the graphs, as shown in the following screenshot:
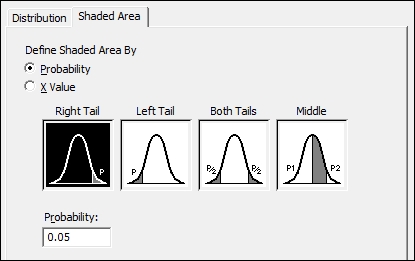
- Click on OK in each dialog.
- To calculate the critical F-statistic from the calculator tools, navigate to Calc | Probability distributions | F....
- Complete the dialog as shown in the following screenshot:
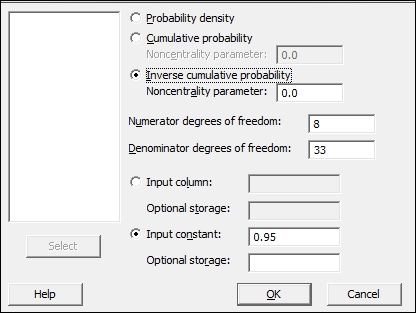
- Click on OK.
The chart that is created will show us the right-hand tail with an area of 0.05. This occurs at 2.235 for the numerator and denominator degrees of the specified freedom. This is then our critical F-statistic, the point at which the p-value for the analysis of variance would equal 0.05.
The probability distribution plot can be used to shade areas of distribution curves as well as to plot the distribution curve. By selecting the right tail of the distribution and 0.05 in the tail of the curve, we ask Minitab to shade the right 0.05 proportion of the distribution, our critical F-statistic.
We could also have found the p-value for a result using the X-value instead of probability and entering the F-statistic that was calculated.
Probability distribution from the Calc menu can be used to return values for probability density, cumulative, or inverse cumulative probability for different distributions. Using the inverse cumulative probability to 0.95, we find the point at which we cover 95 percent of the F-distribution—again, the critical F-statistic.
The p-value can be found from the cumulative probability using the F-statistic obtained as the input value. The result is the cumulative probability up to the entered value. The p-value is 1.