
The stepwise regression has been changed in Minitab v17. In the previous versions, this was its own tool. Now, stepwise regression is an option within the Fit Regression Model… tools. This includes the fit regression models for binary logistic regression and poisson regression. The same options for stepwise regression are used in all three of the fit regression model tools.
We will use the sleep dataset with stepwise regression to select predictors for a regression model.
We will use the total sleep column for the study and specify using the Box-Cox transformation on the response before running the stepwise regression on all two-way interactions.
The data is available at the following link from StatSci.org:
http://www.statsci.org/data/general/sleep.html
The data is tab delimited and can be copied directly into the worksheet. Once the data is in Minitab, calculate the natural log of total sleep. See steps 1 to 5 in the Model Selection, best subsets recipe.
The following steps will use a stepwise regression to identify a regression model within the Fit General Linear Model function:
- Navigate to Stat | Regression | Regression and select Fit Regression Model….
- Enter
TotalSleepin the Responses: section. - In Continuous predictors:, enter
BodyWt,BrainWt,Lifespan,Gestation,Predation,Exposure, andDanger. - To add interactions to the study, click on the Model… button and highlight Predictors: in the top-left section of the dialog box. Then click on the Add button next to Interactions through order: 2.
- Click on OK and then select the Stepwise… button.
- From the Method: drop down, select Stepwise and click on OK.
- Go to the Graphs… button and select the Four in one residual plots and click on OK in each dialog box to run the model.
- Check the results in the session window to observe the fitted model, as shown in the following screenshot:
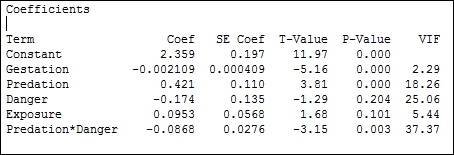
- From the results of the preceding stepwise regression, we should observe that the model converged on a solution of Gestation, Predation, Danger, Exposure, and Predation*Danger.
- To observe predicted responses, navigate to Stat | Regression | Regression and select Factorial Plots.
- Select all available predictors to put them in the plots and click on OK.
- To observe the interaction of
PredationandDanger, generate a contour plot. Navigate to Stat | Regression | Regression and select Contour Plot. - Change the X Axis: section to
Dangerand click on OK.
The stepwise regression will initially run forwards, including terms in the regression model. The first round is to select the predictor with the lowest P-value. The second round continues in the same way, looking to add the predictor that would be the best addition to the model. This continues round by round until no more terms can be added.
The default stepwise method will work forwards and backwards. If a term that was added on a previous round has an increase in P-value above the decision level, it will be removed during the next round. Because of this selection method, we do not study all possible models, unlike the Best Subsets… tool.
If the results here show exposure at round three with a P-value of 0.815, then the fourth round will remove this term.
The stepwise selection method can be changed to forward selection, where terms are added but cannot be removed; or, it can be changed to backwards elimination, where all variables are included in round 1; each subsequent round uses the P-value to exclude a term.
With the steps here, we do not see the decision at each step in the regression; we see only the final fitted model. The Stepwise options can be selected to include the details for each step in the session window. This will reveal the terms included or removed at each point in the model. This will also display R-sq, R-sq(adj), R-sq(pred), and Mallows' Cp for each step as well.
The decision method is based on the alpha risk or the decision for the P-value. The default can be changed along with the method to allow model hierarchy to be calculated as well.