
The Normal tool in Capability Analysis fits a normal distribution to the data before calculating its capability. The sixpack in the previous recipe provides an overview page with control charts, whereas here, we focus on using just the capability histogram. We obtain a more detailed capability metrics output compared to the sixpack without the control charts or distribution plot.
Just like the previous recipe, we will use the study on the fill volume of syringes. The target fill volume is 15 ml with specifications of 14.25 ml and 15.75 ml.
Within the worksheet, 40 results are collected per day at the rate of five samples per hour. The data is presented as subgroups across rows, each row representing the results of the five samples within that hour.
We will generate a capability analysis and add confidence limits to the capability calculations.
The following steps will generate a histogram of the data with specification limits and capability metrics to assess how well the results meet customer specifications:
- Open the worksheet
Volume3.mtwby using Open Worksheet from the File menu. - Navigate to Stat | Quality Tools | Capability analysis and select Normal.
- Select the radio button for Subgroups across rows of.
- Insert the first five measure columns by selecting
Measure1and dragging down to highlight all the columns tillMeasure5. Click on Select to move the columns to the section Subgroups across rows of:. - Enter the Lower spec: as
14.25and the Upper spec: as15.75. The dialog box should look as the following screenshot: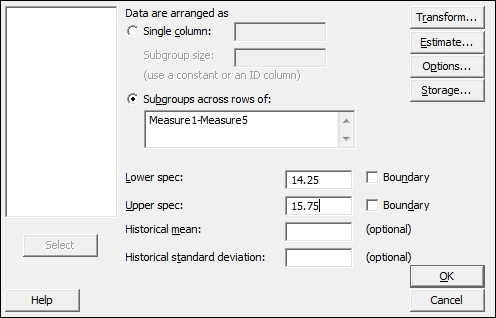
- Click on the Options button, and enter
15in Target. - Check the box Include confidence intervals and click on OK in each dialog box.
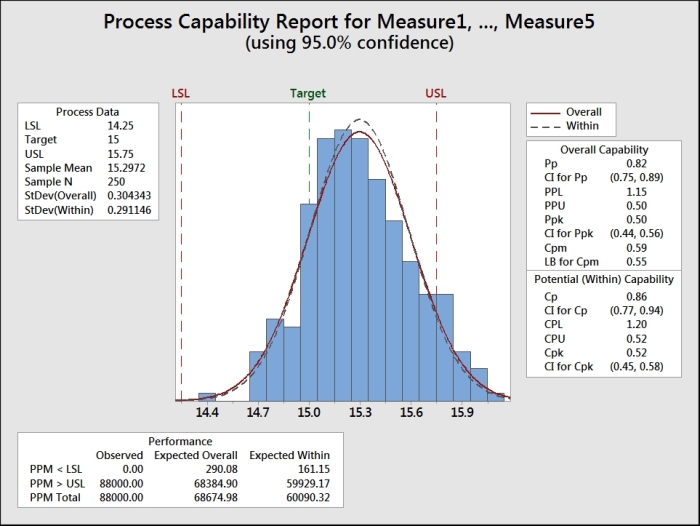
The following screenshot shows the histogram of the data and the two normal distribution curves for the within and overall standard deviation. As with the six pack example in the previous recipe, we use the option for subgroups across rows. For an example of data used in a single column, refer to the Capability analysis for nonnormal distributions recipe.
The capability metrics of Cpk and Ppk are calculated as follows:
-
Cpk is found from the smaller of the
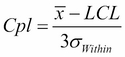 and
and 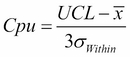 quantities.
- Ppk is found by substituting the overall standard deviation for the within standard deviation.
The calculations for within standard deviation use the pooled standard deviation when the subgroup size is greater than one. We could change this to use either Rbar or Sbar by navigating to Capability Analysis | Normal | Options.
When the subgroup size is one, the default option for within standard deviation is the average moving range. This can be changed to use the median moving range or the square root of MSSD instead.
Along with changing the calculation for within standard deviation, Options allows us to choose between displaying parts per million out of spec, percentage figures for the performance, confidence intervals, and Zbench figures.
Zbench is a capability metric derived from Z LSL and Z USL. Z LSL is a measure of the number of standard deviations from the mean to the lower specification limit, while Z USL is a measure of the the upper specification limit. Z bench takes the area of the normal distribution curve outside both limits and combines the two values to give an overall sigma level.
Confidence intervals are selected to give us a 95 percent confidence interval for the Cpk and the Ppk values.
When we have only one specification limit, the fill volume must only be above 14.25 ml. Then we need to enter only the single specification. The other specification limit must be left blank.
The Boundary checkbox is used to identify a hard limit for the data that cannot be crossed. In most situations, this need not be specified; it could be used when we have a hard limit at zero. We could identify this as a boundary to ignore the results below this figure. As the boundaries indicate that it is impossible to have a value outside this region, we will only calculate the capability to nonboundary limits.
The two measures of capability, Cpk or Ppk, can be confusing. Cpk is calculated based on the within variation of the process. This variation is found from the average range of the subgroups, the average standard deviation of the subgroups, or the pooled standard deviation.
Ppk is calculated from the standard deviation across all the data that are considered as individual values.
The effect is that, the within standard deviation should typically be smaller than the overall. The within standard deviation can be considered as an estimate of the variation when the subgroups have the same mean value. The larger the variation between the subgroups, the greater the difference between the within and overall standard deviation.
We can consider Cpk as an estimate of the capability if our process is stable and Ppk as an estimate of the process performance.