Report Navigation
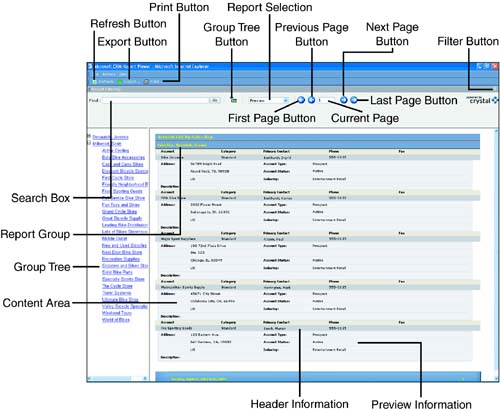
As you begin to use the Microsoft CRM reports, you will notice that the navigation from report to report is very standard. Most reports include the following navigational controls (referenced in Figure 10.2) :
Refresh
Export
Print
Filter
Find
Group Tree
View Selection
Sub Reports
Page Buttons
Figure 10.2. The components of a typical Microsoft CRM Crystal report.
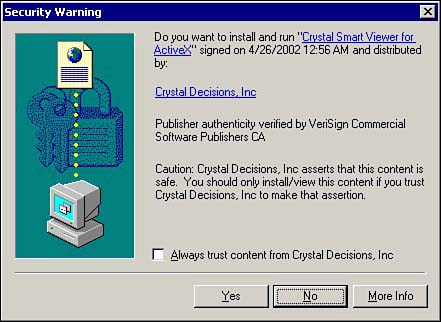
Microsoft CRM reports are Crystal reports, which are displayed in a new window. To simply view these reports, there is no need for additional software on the user's machine. The first time a user attempts to view a Microsoft CRM report, he is presented with a screen asking him to authorize the download of the Crystal Smart Viewer ActiveX control to his browser. Figure 10.1 shows the screen requesting the user's permission to download the Crystal Smart Viewer ActiveX control.
Figure 10.1. Accepting the Crystal Smart Viewer download.
For creation of new reports or modification of the existing reports, Crystal Reports Designer is necessary, along with an enhancement component that makes Crystal aware of the Microsoft CRM schema. Crystal Reports designer is a separate purchase from Microsoft CRM. The enhancement component is free.
Microsoft CRM reports are available exclusively from the Microsoft CRM Web client and, like the Web client, require that the user have access to the CRM server. Currently no reports run from the Microsoft CRM Sales for Outlook client.
Microsoft CRM reports come in two flavors: reports and charts. All reports and charts are interactive in that they accept some amount of manipulation and provide features such as drill downs and filtering.
Figure 10.2 shows the Microsoft CRM Account List By Sales Rep report. This report is fairly typical of the Microsoft CRM reports. By default it lists header and detail information on all Account records. It is broken into multiple pages with information about several Accounts on each page.
Searching within Reports
Using the Search Box enables the user to search across the fields that are displayed on the report pages themselves. This search will not search through fields that are on the records but not presented in the report. For example, if you are searching the Account List By Sales Rep report by SIC code, your search returns no results because SIC code is not a standard field on that report. You might think of this search function as being much like searching on a typical Web page using your browser.
Filtering Reports
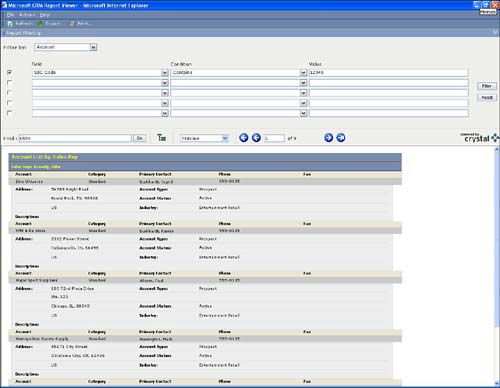
The Filter Button to the right of the report screen enables the user to filter which records are actually returned to the screen. The filter button can filter on fields that are not on the report. However, the report still displays only those fields that it has been configured to display. Going back to our earlier example, you can filter the Account List By Sales Rep report by SIC code and reduce the number of records that are returned to the report, but the SIC codes of the retrieved records will not be displayed in the report. Figure 10.3 illustrates the use of the Filter Button.
Figure 10.3. Using the filter button to reduce the number of records returned to the report.
Grouping Reports
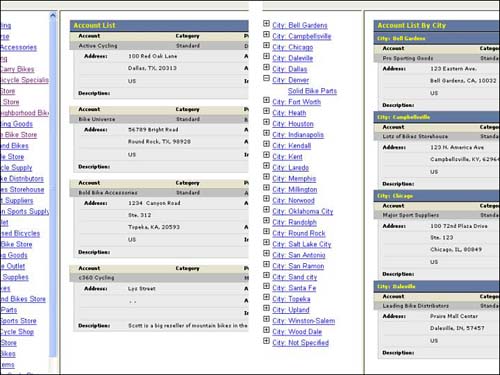
Many of the reports in Microsoft CRM are based on one root report, but are grouped a number of different ways. Reading through the report list later in this chapter you can see the similarities in the report names. The Group Tree button can be used to see the grouped list of records that make up the report. If the report is not grouped, an ungrouped list of the records in the report is listed. For example, if you view the Account List report and click the Group Tree button, you will see a list of all Accounts in the report. If you view the Account List By City report and click the Group Tree button, you are able to expand the node next to the name of each City to see that City's Accounts. Figure 10.4 shows both of these reports side by side.
Figure 10.4. Viewing the Group Tree for an ungrouped and a grouped report.
Drilling Down to Subreports
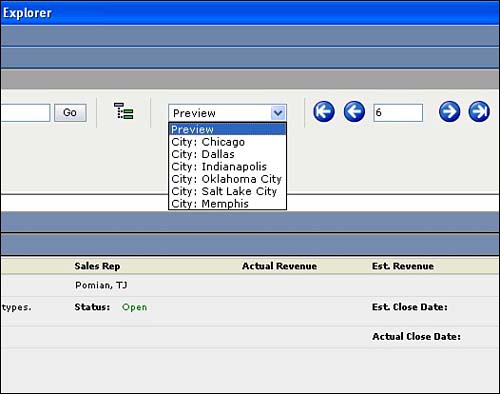
Many of the Microsoft CRM reports enable the user to click information within the content area. Doing so creates a subreport that displays to the user a subset of the data she was viewing. For example, in the Opportunity List By City report, the user is able to click the Report Group bar to drill down to the opportunities for a particular city. This presents a subreport with a title that is listed in the Report Selection list. To return to the main report, the user can then select the default view, titled Preview From the Report Selection list.
Using subreports and the Report Selection menu, a user can compare the information by quickly moving from one set of results to the next. This is shown in Figure 10.5.
Figure 10.5. Using subreports on the Report Preview menu to quickly navigate across results sets.
Charts
Charts in Microsoft CRM graphically illustrate what is happening with the data. One of the best charts is the Pipeline Chart Report By Sales Stage (Sales Process). This is the traditional sales funnel chart over which Sales VPs drool. The Sales Process at the end of the Chart name is a convention to indicate that the report is grouped by sales process. Because we know that Microsoft CRM can support any number of diverse sales processes, this report sorts them out so that you're not viewing all sales stages in a single chart. Figure 10.6 shows the Pipeline Chart Report by Sales Stage (Sales Process).
Figure 10.6. The Pipeline Chart Report By Sales Stage (Sales Process) chart presents a different chart for each sales process.
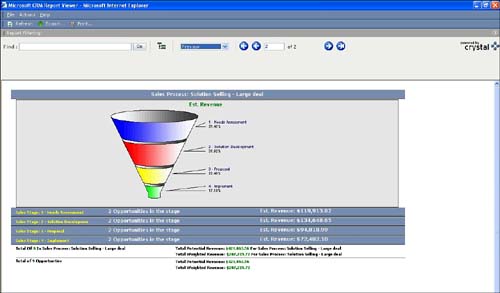
Clicking any slice of the funnel drills down into a subreport listing the opportunities that make up that stage.
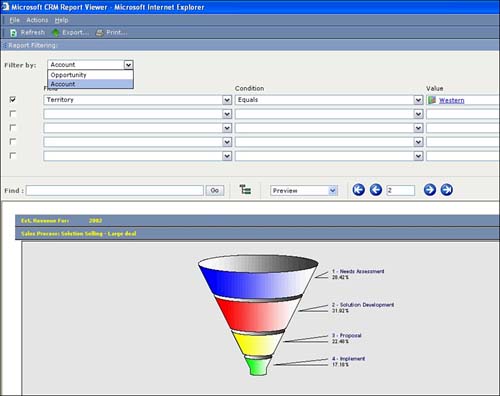
It is worth mentioning that with many reports, filtering is not limited to the records against which you are reporting. For example, with the Opportunity Pipeline reports you can filter based on attributes of the Opportunity records as well as attributes of the Account records. Figure 10.7 displays this with a Pipeline report.
Figure 10.7. Filtering a Pipeline chart by Opportunity or Account attributes.
Exporting Report Data
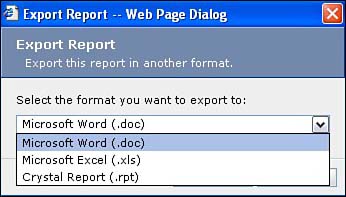
Exporting report data is a simple task, just produce the report you want to export, click the export button, and select the format in which you want to export the report. Microsoft CRM gives you the option of exporting the reports into Excel, Word, or Crystal Reports formats. This is illustrated in Figure 10.8.
Figure 10.8. Report data can be easily exported to Microsoft Word, Excel, or Crystal Reports formats.
If the report has been filtered, only the filtered data is exported. If you are viewing a subreport and click export, all report data, not just the subreport data, is exported.
Although exporting reports is a simple task, the export serves more as a vehicle for producing a copy of the report you could send through email or take away from the system. Exported reports look just like the onscreen reports. Exported reports do not arrange the data in a straight data format that could be used for pivot tables or other analysis.
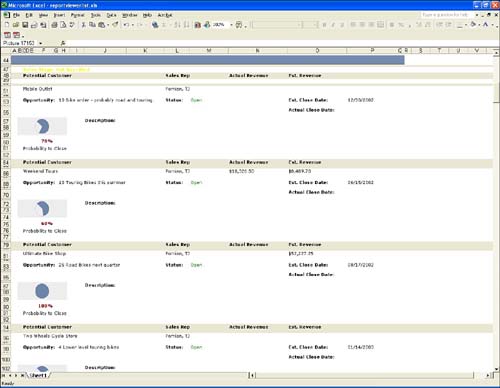
Reports exported to Microsoft Excel and Microsoft Word both use the same format as the onscreen reports generated through the Microsoft CRM Web client. Figure 10.9 shows a report that has been exported to Microsoft Excel.
Figure 10.9. A Microsoft CRM report exported to Microsoft Excel.
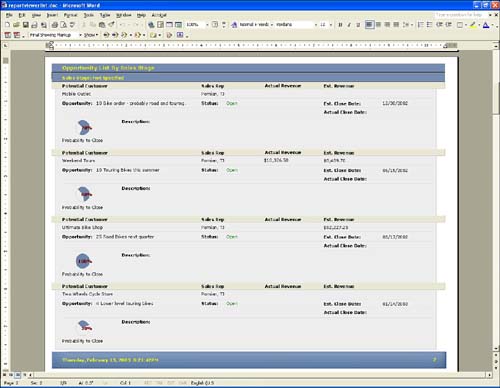
Similarly, Figure 10.10 shows a report that has been exported to Microsoft Word. Notice that it looks nearly identical to the report that was exported to Excel.
Figure 10.10. A Microsoft CRM report exported to Microsoft Word.
Reports Table
The following tables outline what each report does and, in many cases, the strengths and weaknesses of it. In many cases, these reports do exactly what you would expect. In other cases, the data they present might not match what the title implies.
Sales reports in Microsoft CRM center around the concept of the Sales Opportunity object, its related objects (Quotes, Orders, Competitors, and so on) and the core Contact and Account objects that support it. While there are numerous (89) sales reports, many of them are similar to each other but are grouped in various ways.
Before we dive into the report list, let's discuss the concept of the sales pipeline. Many of the sales Opportunity reports use the word pipeline in their titles. The word pipeline is used to indicate that the reports contain data on Opportunities that are in an open status. In other words, data on Opportunities that have already been closed as won or lost will not appear in these reports. Opportunity reports that do not use the word pipeline often include data from all Opportunities regardless of status.
Another concept worth mentioning with respect to Sales Opportunity reports is how these reports accommodate the Standard and Professional Editions of Microsoft CRM. We know that the Professional version of Microsoft CRM includes workflow that can be used to create sales processes which are broken down into sales stages. Because the Standard edition of Microsoft CRM does not have workflow, a field on the Opportunity object is used to designate the Opportunity's sales stage. This field is named salesstagecode. Professional users will likely not even know it exists.
As you browse through the list of Opportunity reports, notice that there are several reports with (Sales Process) listed next to them. Listed immediately prior to these reports is a report by the exact same name, but without (Sales Process). These are pairs of reports, the first for use with the Standard edition and the second for use with the Professional edition. The Standard edition version of the report pulls its sales stages information from the salesstagecode field while the Professional edition pulls its sales stage information from workflow driven sales process listed on the Activities, Sales Process tab of the Opportunity record.
| Report Category & Title | Report Description | Type |
|---|---|---|
| Sales Reports (89) | Sales reports are accessed from a tab named Sales Reports in the left navigation bar of the Reports area. Keep in mind that reports can only be accessed from the Microsoft CRM Web client. The Microsoft CRM Outlook client has a link to reports from its Online Services page, but this simply launches a browser window pointed to the Web client. | Area |
| Sales—Account Reports (15) | Category heading for viewing the list of Account reports. | Category |
| Account Activity and Notes | One Account per page with an Index of Accounts accessed using the Group Tree button. Each Account page lists Account overview information and full text and details of all directly attached Notes and Activities. Does not list detail on Note or Activity attachments. Also does not list Notes attached to the Account's Activities. Each Note and Activity record has a drill down link to a subreport. | Report |
| Account Chart | This chart is somewhat misleading. It displays a pie chart titled Revenue By Account, but the revenue by account metric refers to the Annual Revenue field on the Account record. You'll have to define that field and fill it with meaningful data to make this report work for you. You could do this through workflow if you want, incrementing the field with each closed invoice to keep a running total of revenue from the account. Another option would be to populate the Annual Revenue field with data from your back office system. You can click any slice of this report and drill down to a list of Primary Contacts by Account. There is a generic slice called Other into which all Accounts with lower revenue fall. Figure 10.11 shows the Revenue by Account chart. | Chart |
| Account Chart by Industry | Same as Account Chart except grouped using the Industry field on the Account screen Details tab. | Chart |
| Account Chart by State-Province | Same as Account Chart except grouped using the State field on the Account screen General tab. | Chart |
| Account Chart by Status | Same as Account Chart except grouped using the Account's Status. Because Accounts can only have Active and Inactive Statuses, this report does not provide a lot of information. | Chart |
| Account Chart by Territory | Same as Account Chart except grouped using the Territory field on the Account screen Details tab. | Chart |
| Account Details Report | Includes one Account per page with general information as well as a list of all Opportunities, Quotes, Orders, and Invoices. Clicking an Opportunity, Quote, Order, or Invoice item drills down to detail on that item in a subreport. | Report |
| Account List | List of all Accounts with overview information. 4 to 5 Accounts listed per page. | Report |
| Account List by City | Same as Account List, but grouped by City. The Group Tree button displays a list of cities and enables users to expand each one to see the Account in that City. | Report |
| Account List by Industry | Same as Account List by City except grouped by the Account Industry field. | Report |
| Account List by Sales Rep | Same as Account List by City except grouped by the Account's owner (user). | Report |
| Account List by State-Province | Same as Account List by City except grouped by the Account State field. | Report |
| Account List by Status | Same as Account List by City except grouped by the Account's Status (Active or Inactive). | Report |
| Account List by Territory | Same as Account List by City except grouped by the Account Territory field. | Report |
| Account List by Zip-Postal Code | Same as Account List by City except grouped by the Account Zip-Postal Code field. | Report |
| Sales–Activity Reports (4) | Category heading for viewing the list of Activity Reports | Category |
| Activity List | Lists all Activities and provides detail on each one. This report could get unwieldy quickly. The filter button enables filtering based on Activity or Account fields, so this can be used as a tool for easy viewing of all Activity records attached to an Account. | Report |
| Activity List by Account | Same as Activity List, but grouped by Account. | Report |
| Activity List by Status | Same as Activity List, but grouped by Activity status (Open, Completed, Cancelled). | Report |
| Activity List by Type | Same as Activity List, but grouped by Activity Type (Task, Email, and so on). | Report |
| Sales–Competitor Reports (2) | Category heading for viewing the list of Competitor Reports | Category |
| Competitor List by Product | Lists Competitor records that have Product records linked to them. Competitor records without linked Product records will not show up. | Report |
| Competitor List Won | Lists Competitors that have been linked to Opportunities where the Opportunity was closed with a Status of Won. If you link multiple Competitors to an Opportunity and close it as Won, the report shows a win against each of these Competitors. | Report |
| Sales–Contact Reports (3) | Category heading for viewing the list of Competitor Reports. | Category |
| Contact Activity and Notes | Same report as the Account Activity and Notes report except with Contacts. | Report |
| Contact List | Same report as the Account List report except with Contacts. | Report |
| Contact List by Account | List of Contacts with basic information, one line per Contact. Grouped by Account. | Report |
| Sales–Invoice Reports (4) | Category heading for viewing the list of Invoice Reports. | Category |
| Invoice Detail | One Invoice per page with all Invoice information. | Report |
| Invoice List by Customer | One page per customer (Contact or Account) with a list of all Invoices for that customer. Does not allow drill down into Invoice details. | Report |
| Invoice List by Status | List of Invoices by Status (Active, Inactive). | Report |
| Sales–Lead Reports (3) | Category heading for viewing the list of Lead Reports. | Category |
| Lead List | Listing of Leads with preview information. | Report |
| Lead List by Lead Source | Listing of Leads with basic information. Grouped by Lead Source. List all Lead Statuses (Open, Qualified, Disqualified). | Report |
| Lead Source Summary | This report is listed as a Report, but also has a Chart in it. Displays a pie chart showing a slice for each Lead source. User is able to click a slice and drill down into a specific Lead Source to see Leads in that Category. | Report |
| Sales–Miscellaneous Sales Reports (0) | There are no reports in this category. | Category |
| Sales–Opportunity Reports (40) | Category heading for viewing the list of Opportunity Reports | Category |
| Contact List By Opportunity | As you would suspect, this report lists all Opportunities (to which the user has access) and their associated Contacts. The list of Contacts includes all the linked Other Contacts as well as the Owner if the Owner is a Contact record or the Account's primary Contact if the Owner is an Account. | Report |
| Converted Leads to Opportunities Chart | You might suspect that this report would display all Leads that have been converted to Opportunity records. However, the report displays only information on “won” Opportunities that have been converted from Leads. The report shows a single bar for each month indicating the number of leads converted to opportunities and closed as “won” in that month. | Chart |
| Opportunity Activity and Notes | One page per opportunity with a list of all Activities (including detail) associated with the Opportunity. Any report listing Activities tends to get large, but this report could be an easy way to quickly read through Opportunity details without a lot of clicking. Exporting it would be a way of providing a non-CRM user with Opportunity details. | Report |
| Opportunity Contact List | Don't confuse this report with the Contact List By Opportunity report. This report always lists one Contact per Opportunity; that being the Parent Contact or the Primary Contact of the Parent Account. | Report |
| Opportunity Detail | One page per Opportunity including Opportunity record details and lists of Other Contacts, Products, and Activities. | Report |
| Opportunity List | List of all Opportunity records with preview information for each. | Report |
| Opportunity List By Account | Same as Opportunity List but grouped by Account. | Report |
| Opportunity List By Business | Same as Opportunity List but grouped by Business Unit. | Report |
| Opportunity List By City | Same as Opportunity List but grouped by Account City. | Report |
| Opportunity List By Close Date | Same as Opportunity List but grouped by Close Date. This report lists each Close Date to the day level, so there will be a grouping for all days that an Opportunity is projected to close. | Report |
| Opportunity List By Competitor | Same as Opportunity List but grouped by Competitor. As you might expect, this report includes a single Opportunity multiple times if more than one Competitor record is linked to it. | Report |
| Opportunity List By Estimated Revenue | Same as Opportunity List but grouped by Estimated Revenue. Grouping is done by unique estimated revenue amount so, for example, Opportunities with estimated revenue of $50,000 fall into a different group (the $50,000 group) from Opportunities with estimated revenue of $50,001. Unless you have consistent revenue levels, this grouping might be too granular to be meaningful. | Report |
| Opportunity List By Lead Source | Same as Opportunity List but grouped by Lead Source. Keep in mind that if your Opportunity records are not generated from a Lead conversion or are not linked to an originating Lead, their lead source will be blank. | Report |
| Opportunity List By Month | Same as Opportunity List but grouped by Month. However, the Month used for the grouping is the “created on” month, not the “close date” month. If you import data and set the “created on” date to the import date, you only see one grouping in this report. | Report |
| Opportunity List By Sales Rep | Same as Opportunity List but grouped by Sales Rep. | Report |
| Opportunity List By Sales Stage | Same as Opportunity List but grouped by the Microsoft CRM Standard edition sales stage. This is the sales stage code field we discussed earlier. This report will be of no value to implementations of the Professional edition of Microsoft CRM. | Report |
| Opportunity List By Sales Stage (Sales Process) | Same as Opportunity List but grouped by the Microsoft CRM Professional edition sales stages as defined through workflow manager. It is important to note that because the Microsoft CRM Professional edition allows for multiple sales processes, this report is grouped by unique sales process. | Report |
| Opportunity List By State-Province | Same as Opportunity List but grouped by Account State or Province. | Report |
| Opportunity List By Status | Same as Opportunity List but grouped by Opportunity Status. Opportunity statuses are open, won, and lost. | Report |
| Opportunity List By Territory. | Same as Opportunity List but grouped by Account If the Opportunity record is parented by a Contact instead of an Account, no Territory is specified, regardless of whether the Contact is linked to an Account that is linked to a Territory. | Report |
| Opportunity List Originating Lead | This is a list of all Opportunities grouped by their Originating Lead. Because each Opportunity has at the most one Originating Lead, this report grouping has very limited usage. | Report |
| Opportunity List Won-Lost Chart | Bar graph of Opportunities closed by month closed. Each bar is broken into colors representing the percentage of Opportunities won, out sold, or canceled. Canceled and Out-sold are the default subresolutions the user can select when closing an Opportunity as Lost. | Chart |
| Opportunity List Won-Lost Chart By Sales Rep | Same as Opportunity List Won-Lost Chart, but one page per Sales Rep. | Chart |
| Opportunity List Zip-Postal Code | Same as Opportunity List but grouped by Zip-Postal Code. | Report |
| Pipeline Chart Report by Originating Lead | Bar chart listing one bar per originating lead. Because most Leads result in only one Opportunity, this report likely ends up effectively listing one bar per Opportunity. | Chart |
| Pipeline Chart Report by Product | Bar chart listing all Products on open Opportunities. Each bar represents the overall projected revenue per Product. User can drill down to the Product level by clicking a bar. When at the Product level, the report is grouped by Close month. | Chart |
| Pipeline Chart Report by Sales Rep | Bar chart listing one bar per Sales Rep with the bar representing the total overall revenue. Drilling down into a Sales Rep's bar lists that Rep's Opportunities grouped by month. Beware that the revenue amount listed on each bar is the total, not weighted, revenue amount for the Rep's Opportunities. | Chart |
| Pipeline Chart Report by Sales Stage | This is the Standard edition version of the traditional graphic funnel report that Sales VP's love. Clicking a slice/stage of the funnel lists the Opportunities in that stage. This report has no grouping. | Chart |
| Pipeline Chart Report by Sales Stage (Sales Process) | This is the Professional edition version of the previous report. This report is grouped by Sales Process so that conflicting processes/stages are not mixed in together. Each Sales Process has its own funnel graphic. | Chart |
| Pipeline Chart Report by Territory | Bar chart listing one bar per Account Territory. Opportunities linked to Accounts end up in the Not Specified territory. A revenue number on each bar is the total revenue and not the weighted revenue. | Chart |
| Pipeline Chart Report Sales Forecast | Two bar charts representing the sales opportunity pipe-line. The first bar chart shows potential revenue (raw revenue) grouped and totaled by month of estimated close date. The second bar chart shows the weighted revenue also grouped and totaled by month of estimated close date. Clicking the Group Tree button shows that the report is grouped by year. By default, the current year page is initially loaded. This report is a good way to get a quick idea of the overall pipeline as well as your sales team's overall confidence in the opportunity set. Figure 10.13 displays the main content of this report. | Chart |
| Pipeline Forecast by Sales Stage Chart | This is the Standard edition version of the following report. This report is very similar to the Pipeline Chart Report by Sales Stage except that it is grouped by year. This is why the word Forecast is included in the title. The same concept applies to the following report. | Chart |
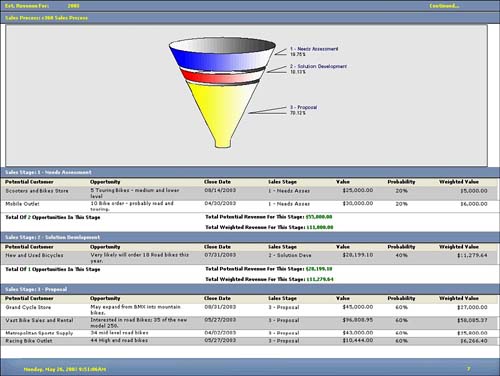
| Pipeline Forecast by Sales Stage Chart (Sales Process) | This is the Professional edition version of the traditional funnel chart. This report is very similar to the Pipeline Chart Report by Sales Stage (Sales Process) except that it is grouped by year. It is also grouped by Sales Process so that conflicting processes/stages are not mixed in together. Each Sales Process has its own funnel graphic. It is also grouped by Year and Sales Stage. Figure 10.14 displays the main content of this report. Notice that the two blue bars at the top of the report indicate the two levels of grouping; year (of estimated close dates) and sales process. Below the funnel chart, the report is further grouped by the stages of the sales process. | Report |
| Pipeline Report | List of all open Opportunities. | Report |
| Pipeline Report By Originating Lead | List of all Opportunities by Lead Source. This report provides a simple listing of the key sales opportunity data points including customer, (estimated) close date, sales stage, value (revenue), probability, weighted value (revenue). Lists only opportunities that are in the open status. | Report |
| Pipeline Report By Product | List of all Opportunities by containing certain opportunity products. This report provides sales personnel the ability to see all opportunities for a particular product line and determine how successful sales campaigns for each product are performing. | Report |
| Pipeline Report By Sales Rep | Another report written solely to appease the sales VP, this report presents the user with a bar chart subreport with estimated revenues and includes a salesperson breakdown of all active opportunities. Clicking within the bar chart retrieves more detail about a particular sales person. All and all, a very effective report for tracking sales rep effectiveness. | Report |
| Pipeline Report By Sales Stage | This is the Microsoft CRM Standard edition version of the simple pipeline report, grouped by sales stage(using the salesstagecode field). This report is similar to the Pipeline Chart Report By Sales Stage except that it includes no graphical representation of the data. | Report |
| Pipeline Report By Sales Stage (Sales Process) | This report is the Microsoft CRM Professional edition version of the previous report. It is grouped by Sales Process and Sales Stage. | Report |
| Pipeline Report By Territory | Similar report to the other Pipeline reports although this report makes use of the Sales Territory code entered on the opportunity form. This report enables sales management to track sales performance and forecasting of disparate sales teams for comparison and effective sales management. | Report |
| Sales–Order Reports (5) | Category heading for viewing the list of Order Reports. | Category |
| Order List | Essentially, a list of all orders booked within the Microsoft CRM application. This report can become somewhat convoluted with information in that it is simply a list of all orders made. For more detailed organization of Order data, use one of the following reports. | Report |
| Order List By Customer | This report logically segments Order data to be organized by customer. | Report |
| Order List By Quote | This report logically segments Order data to be organized by Quote. Enables organizations to track the effectiveness of the quote/proposal process within an organization. | Report |
| Order List By Sales Rep | Quite simply, this is just another extension of the Order List report, although this report is summarized by sales rep. Valuable information that can be extracted from this information is Order status and whether the organization is meeting its requested ship dates. | Report |
| Order List By Status | Again, another extension of the Order List report, but this report segments information by Status. For the same reasons listed in the previous report, the Order List by Status enables our organization to view whether it is meeting requested ship dates and where certain orders lie within the Order Fulfillment process. | Report |
| Sales–Product Reports (4) | Category heading for viewing the list of Product Reports. | Category |
| Product List | Basic domain-level information regarding all opportunity products within the system. Where this report provides value is in the Quantity On Hand column within the report. This report enables full understanding and communication regarding inventory levels and back-order information. | Report |
| Product Sold by Contact | By contract, a complete listing of products sold. This report works well in building internal best practices for how to structure contracts based on the effectiveness of a particular contract. | Report |
| Product Sold by Month | Monthly listing of products sold using the Microsoft CRM system and the Opportunity object. | Report |
| Product Sold by Sales Rep | Sales and Sale Quantity information regarding a particular sales representative. This report is purely transactional reporting organized by Sales person. | Report |
| Sales–Quote Reports (3) | Category heading for viewing the list of Quote Reports. | Category |
| Quote List by Opportunity | This report is structured so that sales reps and managers understand all the open proposals that might be associated with a particular opportunity. | Report |
| Quote List by Sales Rep | Provides a logical grouping of all proposals that have been created by Sales representatives. | Report |
| Quote List by Status | Follows a similar pattern as the previous two reports, but this report groups the information by Order Status. | Report |
| Sales–Sales Literature Reports (2) | Category heading for viewing the list of Sales Literature Reports. | Category |
| Sales Literature List | Listing of Sales Literature, internal contact, and expiration information regarding a certain piece of literature. | Report |
| Sales Literature List By Subject | Using the business logical grouping hierarchy, this report presents the user with all sales literature information structured by Microsoft CRM subjects. | Report |
| Sales–Sales Quota Reports (4) | Category heading for viewing the list of Sales Quota Reports | Category |
| Sales Quota–Fiscal Periods By Sales Rep | Quota performance to actual for fiscal periods (as set in system customization), grouped by sales rep. | Report |
| Sales Quota–Fiscal Periods By Territory | Same as the previous listing, but grouped by Territory. | Report |
| Sales Quota List–All Sales Reps | Sales Reps and Quotas grouped by fiscal year. | Report |
| Sales Quota List–All Territories | Same as above, but grouped by Territory. | Report |
Figure 10.11. The Revenue by Account chart in the Account Chart report.
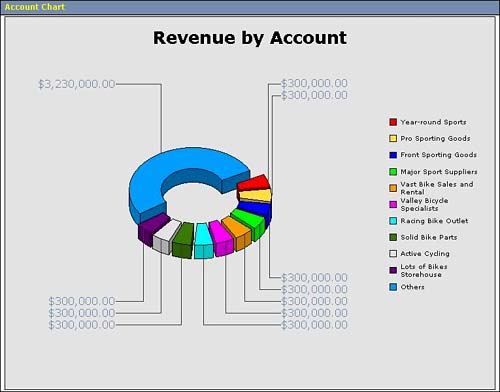
Figure 10.13. The Pipeline Chart Report Sales Forecast.
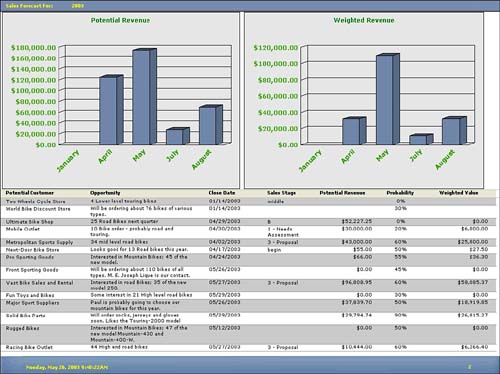
Figure 10.14. The Pipeline Forecast by Sales Stage Chart (Sales Process).
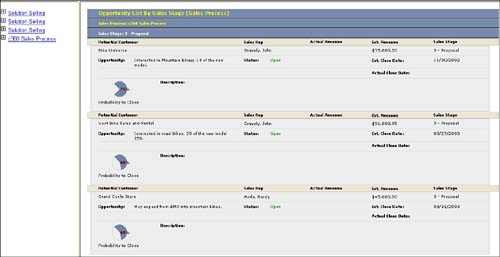
NOTEIn Chapter 12, “Workflow,” we see that Microsoft CRM creates a new sales process each time the sales process is modified. We'll get into the details of this later, but keep in mind that when viewing reports you may see what appears to be the same sales process listed multiple times. This occurs when a sales process has been deactivated and modified and then reactivated. Figure 10.12 shows an Opportunity List report with groupings by three different “Solution Selling” processes. This is displayed this way because Microsoft CRM sees these three iterations of the process as three different processes. Figure 10.12. A modified sales process will be displayed as if it were different sales processes.
|
Customer Service reports in Microsoft CRM center around the concept of the Service Case object and the core Contact and Account objects that support it. While there are numerous (45) Customer Service reports, many of them are similar to each other but are grouped in various ways.
| Report Category & Title | Report Description | Type |
|---|---|---|
| Service Reports (45) | Customer Service reports are accessed from a tab named “Sales Reports” in the left navigation bar of the Reports area. | Area |
| Service–Account Reports (15) | These reports are the same reports listed in the Sales–Account Reports section. | Category |
| Service–Case Reports (23) | Category heading for viewing the list of Service Case Reports | Category |
| Account Service Report | Report showing all Cases recorded in the system for a particular Account. | Report |
| Average Case Turnaround Time and Number Of Cases By Owner | Chart of Users illustrating Cases grouped by Owner with the average time to resolve the case. | Report |
| Case Activity and Notes | Listing of basic Case information with attached Activities and Notes. | Report |
| Case Activity By Case | This report did not appear to include any data at the time of this writing. | Report |
| Case List | List of all cases tracked using Microsoft CRM. | Report |
| Case List By Contact | Same as Case List grouped by Contact. | Report |
| Case List By Customer | Same as Case List grouped by Customer. | Report |
| Case List By Owner | Same as Case List grouped by Owner. | Report |
| Case List By Resolution | Same as Case List grouped by Resolution. Because the resolution is the free-form text the user enters upon closing a Case, the number of different (or differently worded) values continually increases making this report less and less useful as more Cases are resolved. | Report |
| Case List By Status Reason | Same as Case List grouped by Status Reason. Because the status reason field values can be modified, this report as well as the Case Status Chart reports will likely be the best reports for analyzing the outcomes of Service Cases. | Report |
| Case Resolution Chart | Pie chart of Cases by Resolution. Again, like the Case List by Resolution report, this report groups Cases by the free-form resolutions users enter when resolving a Case. It will be difficult to keep this list to a consistent set of values. | Chart |
| Case Status Chart | Pie Chart of all Cases grouped by the Cases' Status Reason values (not Status!)fields. Because this report uses the Status Reason field, it is ideal for getting a quick overview of all Cases as well as the outcomes of the resolved Cases. Figure 10.15 shows this report. Clicking on any of the pie slices takes the user to a list of the Cases that make up that slice. | Chart |
| Case Summary | Short overview of all Case records. No grouping. | Report |
| Case Summary By Customer | Same as Case Summary but grouped by Customer (in other words Parent Contact or Account). | Report |
| Case Summary By Owner | Same as Case Summary but grouped by Owner (User assigned to the Case). | Report |
| Case Summary By Resolution | Same as Case Summary but grouped by Resolution. Again, this is the free-form text Resolution entered by the user, so this has questionable value unless your users are uncommonly consistent. | Report |
| Case Summary By Status | Same as Case Summary but grouped by Status. | Report |
| Case Turnaround Time | Simple listing of Cases with turnaround time in days. No grouping. | Report |
| Case Turnaround Time By Customer | Same as Case Turnaround Time but grouped by Customer. | Report |
| Case Turnaround Time By Owner | Same as Case Turnaround Time but grouped by Owner. | Report |
| Cases Opened By Day Chart | List of Cases that are opened for a particular date. | Chart |
| Cases Resolved By Day Chart | List of Cases that are resolved for a particular date. | Chart |
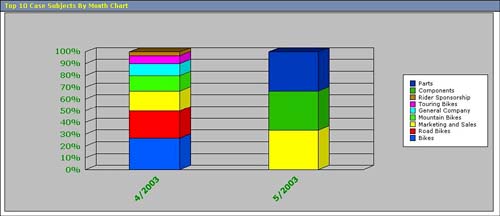
| Top 10 Case Subject by Month Chart | Monthly report enabling managers to understand what types of cases are being tracked using Microsoft CRM. This report is a bar graph showing a different bar for each month. The month is based on the creation date of Cases. Each bar is divided into colored segments illustrating the makeup of Cases by subject for the month. As the report name implies, this graph shows only the to p 10 subjects against which Cases were created in the month. Figure 10.16 shows the main content of this report. | Chart |
| Service–Contact Reports (3) | These reports are the same reports listed in the Sales–Contact Reports section. | Category |
| Service–Contract Reports (1) | Category heading for viewing the list of Service contact Reports. | Category |
| Contract List | List of all Support Contracts within the system. Great report for providing details regarding all service level agreements signed by the organization. | Report |
| Service–Knowledge Base Reports (3) | Category heading for viewing the list of Service Knowledge Base Reports. | Category |
| Knowledge Base List | List of all submissions made into the Microsoft CRM Knowledge Base. | Report |
| Knowledge Base List By Publication Status | List of all submissions into the Knowledge Base, but arranged to reflect statusing within the Knowledge Base approval process. | Report |
| Knowledge Base List By Subject | List of all article submissions made into the Knowledge Base that are organized by business hierarchy. | Report |
| Service–Miscellaneous Service Reports (0) | There are no reports in this category. | Category |
Figure 10.15. The Case Status Chart groups Cases into Status Reason slices of a pie chart.
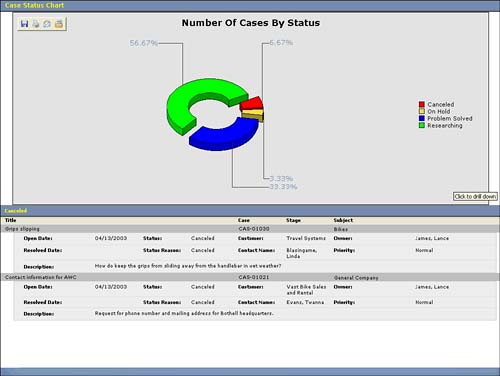
Figure 10.16. Top 10 Case Subject by Month Chart.
The Microsoft Administrative reports provide information related to Users, Teams, and Business Units. These reports will be helpful to the CRM administrator and the individuals whose job it is to plan and manage the deployment.