
CryENGINE has a huge variety of different built-in debugging and profiling tools. As you will soon find out, some of them are very specific to a certain subsystem and only useful for advanced users of the technology.
Others tools, however, are very useful for most engine users in their regular daily workflow. This recipe lists the profiling console variables and commands that each programmer, artist, and level designer working with CryENGINE should know.
To demonstrate the uses of the profiling tools it is not imperative that you have any particular level open; however, to see real data you should have opened a populated level.
The proverbial first line of defense for developers in profiling and reading performance in the Sandbox is the display info console command. It is on by default in the Sandbox.
Notice that you can enable and disable displaying the debug information through typing r_displayinfo 0 or 1 into the console.
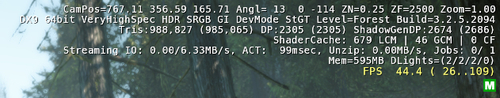
This command displays important information concerning your overall performance. Some of the major values that you should be able to identify are:
These values are important because typically the entire project sets budgets around these values. Other than the camera position if you notice abnormal values or activities in any of these values, you can be sure that you are experiencing some sort of performance loss. The most effective measurement of performance is frame time. Frame time refers to the time that each frame takes from the beginning to the end and is usually expressed in milliseconds (ms).
The reason for this is that Frames Per Second or FPS is defined as 1/frame time and is hence a non-linear measure. To put this into perspective, this means an increase of two FPS when the game running at 20 FPS, gives an extremely profitable gain of five ms, while the same two FPS improvement on a game running at 60 FPS, will just result in a gain of only 0.5 ms.
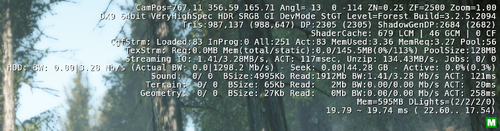
By setting r_DisplayInfo to 2 instead of 1, it is possible to see the frame time instead of the FPS. Here are some useful conversions:
- 16 ms = 60 FPS
- 33 ms = 30 FPS (target for CryENGINE)
- 40 ms = 25 FPS
Performance can heavily depend on the run-time environment. It is thus quite important to use similar conditions when comparing performance numbers on different levels and on different system specifications. The performance on systems with different hardware, for example, is likely to vary a lot. The GPU time is also very dependent on screen resolution. The higher the resolution used, the lower the overall performance will become. Being able to accurately measure and read the performance of your game in Sandbox and from the launcher allows you to set budgets and follow them when creating the content.
You will surely want to know what constitutes a Draw Call and where their values and costs come from, as well as how to deal with budgets and triangle counts.
Every object with a material has a separate Draw Call. This also means that every sub material in a material is a separate Draw Call.
Each Draw Call means setting material data and some other extra work on the CPU side plus fill rate costs on the GPU side. This varies depending on screen area occupied by the Draw Call itself.
Draw Call count will be affected depending on a certain number of conditions:
- Opaque geometry has at least two Draw Calls: one for the Zpass otherwise known as the Depth Pass, and the other for general rendering.
- Shadows are extra Draw Calls, as are detail passes. There may even be material layers such as wet or frozen that will add to this count.
- The amount of non-deferred lights affecting geometry.
Strive to maintain an acceptable Draw Call count, which is typically around 2000 Draw Calls. This can be done easily on design as well as art side and should be monitored at all times on a per view basis.
One way to view just the triangles in CryENGINE is to enable wireframe. You can do this using the console variable r_wireframe = 1.
This visualizes what the display information is saying it is currently drawing for triangles. This should be monitored and can usually identify faults in occlusion as well as view distance ratios.
In most cases, it is impossible to define specific per-object budgets for each art asset - the final makeup of each view in the game depends on too many variables (how many objects, how many characters, how much vegetation, and so on).
For example: A good overall budget should have:
These budgets represent final in-game maximums for any particular view, including all rendering features and effects (after the entire scene has been polished).
These budgets do not give the environment or character artists a clear budget for how many triangles to put into a building or a character but rather define how much can be viewed at one time. It can be used by level artists to determine how many whitebox buildings should go into a particular view and still leave enough room for characters, vehicles, and even particles.
- Go to the Creating a new level recipe in Chapter 2, Sandbox Basics to create your own level to be profiled
- Carry onto the next recipe to find out more about profiling level performance with a printout