
In this recipe, we will create an XML report with statistics for the currently loaded level. The report includes all assets that are loaded, their size, dependencies, and the number of instances in the scene.
The report that we will generate will be created as an .xml and can be opened by using Microsoft Excel.
The Save Level Statistics printout is accessible in two main ways. Both are quite simple:
- The first way is to use the Tools menu in the Sandbox and navigate to the Save Level Statistics option:

- The second way is to output the level statistics by using a console command. Triggering the writing of the data from the console is quite useful when running in the launcher. The console command you must enter is
SaveLevelStats.
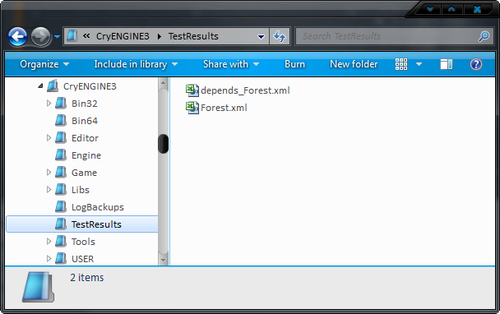
Performing this command through either method will create two .xml files under the rootdirectory/testresults folder.
The names of these files contain the names of the level that they were saved from. For example, the two files in the following example were saved from forest.cry:
These files are best opened with Microsoft Excel. Open Forest.xml in Excel. The first page of the Save Level Statistics printout gives some important information:
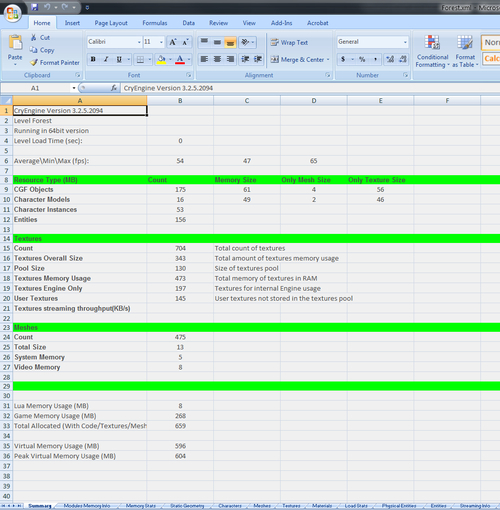
It describes the engine version, the level, and whether the engine is running in a 32 or 64 bit configuration. It also shows the average minimum and maximum frames per second.
The overall cost of a level can be quickly observed here as the count for static CGF geometry is printed as well as for character models and finally entities. It even shows the memory consumption required for each type.
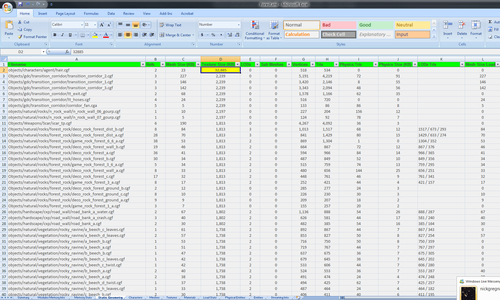
You can also get various profile information through the different pages generated. You can change these pages in Excel easily by clicking the corresponding tab. Click on the Static Geometry tab. In this tab, you can see in depth information on every static piece of geometry in the level.
You can arrange the worksheet by using Excel's arrange feature to make it, so it sorts objects from highest to lowest in a certain column. In the following example, you can easily see a performance issue where a hair object is taking up a much greater amount of texture memory than it should:
There are many more tabs and values associated with each. Some tabs will only be useful to people working with code, such as, module memory. Others will be important for artists, such as static objects and characters. Close the Forest.xml and open the depends_Forest.xml.
The entire file prints out the dependencies of certain files on other files. For example, it shows that a certain .mtl might have six different textures depending on it.
In a lot of cases, this can be used to reduce build and distribution sizes as well as identify areas and objects where textures might be able to be combined.
The Save Level Statistics prints out a variety of information in regards to a level as well as the asset within certain levels. Being able to now print out this information into an Excel spreadsheet allows complex operations to take place, such as tracking performance of a certain level over its development or even identifying problem assets.
As it is in an Excel sheet, further systems could be created within Excel to graph the improvement of level performance over time as it is developed.
There are many different tabs presented to you in the Save Level Statistics printout. You will want to know more about some of the values within it.
In the Textures tab of the Save Level Statistics printout, a common practice is to sort the entire list from highest to smallest in order of texture memory.
When doing this you will inevitably notice values such as $HDRTarget or $SceneTarget.
Any textures with a $ proceeding them are known as render targets. These are not authored textures but rather scene render targets that are generated by using different shaders and post effects in real-time graphics. The texture size of the render target will depend in most cases on the current render window size.
In most geometry related printouts, you will see values for both the number of triangles not only a particular objects physics mesh is contained but also the physical size in kilobytes (KB). This can be a very easy place to find problems with physics meshes and performance, as almost all objects need a physics mesh and it must be as small as possible. The other modifier of physics size is the user-defined properties contained within the asset.