In this recipe, we will explore the different modes that you can enable in the Sandbox to be able to track down and spot the performance and assets problems.
This recipe will make extensive use of the console and in the previous performance cases you must have a populated level opened for the majority of these functions.
As our goal is to provide the best performance, we need to be able to visually observe the impact of using different debugging features, especially how to use them in combination with each other:
- The first debug view that we will use will be the
r_stats 1view. Enterr_stats 1into the console to enable this: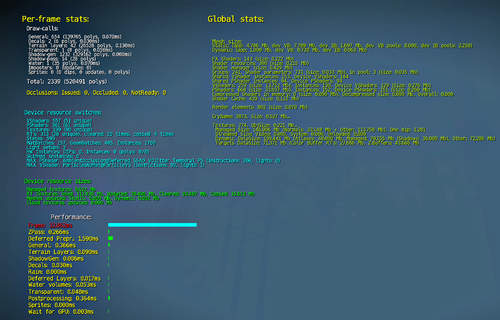
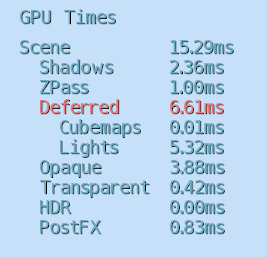
This view breaks down the per-frame statistics of the renderer. This is extremely important as the render takes up the highest percentage in most cases of the frame time. It is also the most important view to use when following certain budget guidelines as designers and artist have direct control over these variables by adjusting the number of lights in their viewable scenes or even decals.
- The next view will allow you to asses the Draw Calls created by different effects as well as by materials on objects. With the advanced deferred lighting solution within CryENGINE, you can have a large number of deferred lights to achieve advanced effects with minimal effect on the Draw Call count. However, it is still very valuable to be able to view the breakdown of Draw Calls by object within a scene.
- Enable this by using
r_stats 6.
- This will show the Draw Call cost of each object on the screen. They are listed by depthpass calls, general calls, shadows calls, and finally misc.
Another important consideration here that could be noted would be to use normal maps for decals as they add to the depth pass calls.
Finally, we will explore overdraw:
- Disable
r_Stats 6by typingr_stats 0into the console. - Enable the overdraw render mode by typing
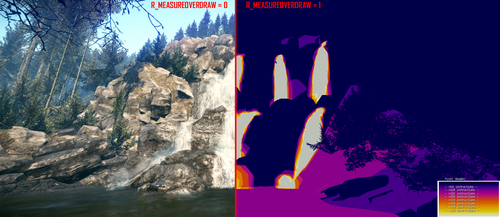
r_measureoverdraw 1: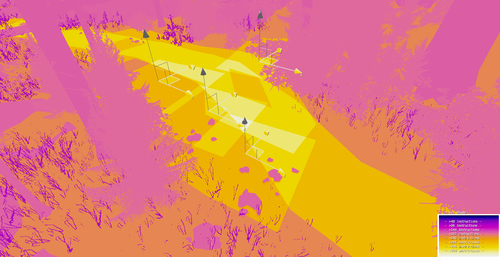
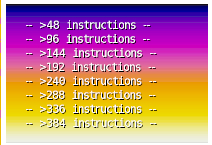
This view allows you to visualize the amount of pixel instructions per pixel in a scene. Overdraw is caused by a number of things, including alpha blending where a pixel is calculated multiple times.
In the previous example, you can see the selection of four decals that overlap each other and a road texture that is also alpha blended. The surrounding vegetation and terrain is relatively low cost but the overlapping decals and road add greatly to the pixel cost.
The final section of debug views we will now explore is the entity debug draws. These enable a number of different debug draws that for the ease of writing we will not cover.
Type in P_draw_helpers 1 to the console. This view is one of the most useful entity debug draws that a developer can use when adjusting physics. This view essentially shows the view the physics system has of the engine. Different levels of physical simulation are shown as different colors in this view:
Being able to enable the various debug views is essential! For designers it is especially important as they are the ones that spend the most time in Sandbox putting all the assets together and usually have a direct impact on the overall per view performance in a level.
You may want to know more about visualizing overdraw in your scene as well as some extra console variables available to you when debugging assets.
Depending on your performance guidelines you may have different budgets or need to view different scales of r_measureoverdraw command. You can do this by adjusting the r_MeasureOverdrawScale command, which will adjust the representation color of the number of instructions required in each pixel: