
We have already seen a few ways to monitor our infrastructure with Zabbix. One of the other supported methods of Zabbix is IPMI monitoring. If you still have no clue what we are talking about then maybe ILO or DRAC will tell you more. DRAC is from Dell and stands for Dell Remote Access Controller and ILO is from HP and stands for Integrated Lights-out. Most of these interfaces come in servers as extra cards, and make it possible for us to monitor our hardware directly without the need of an operating system. The server doesn't even need to be turned on to monitor the hardware.
For this topic, you need as usual a properly configured Zabbix server. Make sure you have compiled the server with support included for OpenIPMI. We also need some IPMI capable device, probably a server with a remote management card.
- First thing we need to do is go to our server and create a user for Zabbix in our IPMI device. It's wise to create on all servers, an extra user just for Zabbix instead of making use of the administrator account as Zabbix only needs read access.
- Make sure IPMI tool is installed and OpenIPMI. This can be done by running:
yum install impitool OpenIPMI OpenIPMI-libs - We can test our access to the IPMP interface with the next command:
ipmitool -U <ipmi user> -H <IP of ipmi host> -I lanplus -L User sensor - When we run this command, we need to enter our password and the IPMI interface will return us some similar output (this is the output from a HP ML350 G5 server).
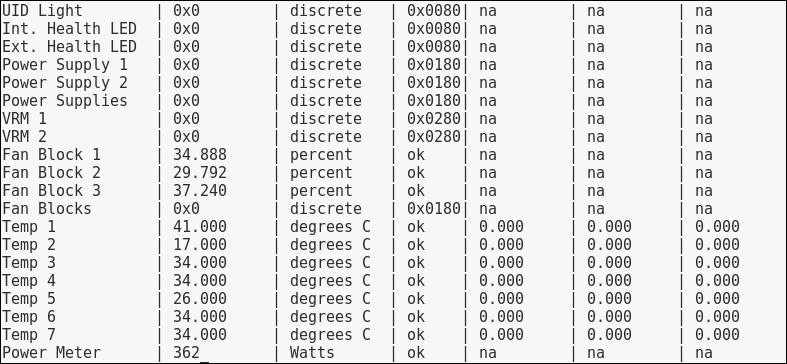
- Next we need to configure our Zabbix server. For this, we have to go to the host interface. Remember this can be found under Configuration | Host.
- Under IPMI Interfaces, add the correct IP address of the IPMP interface with the correct Port.

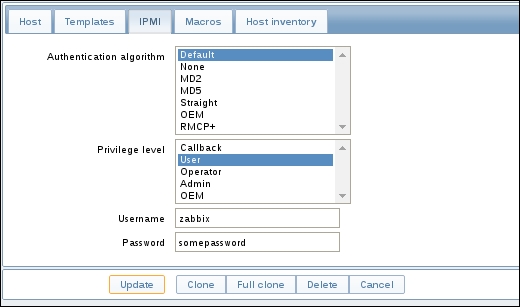
- When this is done, go to the tab IPMI on the same page and fill in all the fields:
- Authentication algorithm in our case can stay
Default. - Privilege level in our case can stay
User. - For Username and Password, we need to fill in the username and password created in the IPMI interface for Zabbix. As you can see, the password is visible to everybody with administration rights.
- Don't forget to click the Update button when you are finished.
- Authentication algorithm in our case can stay
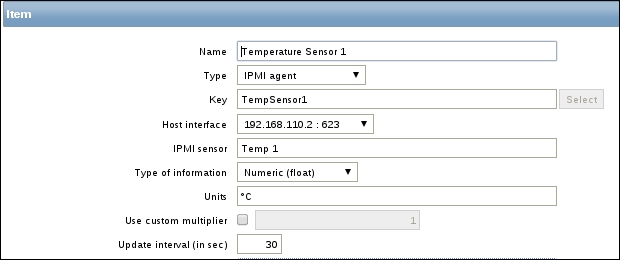
- The next step is to create a Zabbix item. As usual, we first fill in the name of our item.
- As Type we select
IPMIagent. - Make sure that the Host interface is the correct one that points to our IPMI.
- For the IPMI Sensor, we can select one of the sensors that the IPMI returned when we checked it with our IPMI tool. The name must be exactly the same as returned by the IPMI tool.
- The rest of the information depends on the item that you want to monitor; in this case, the returned Type of information is a float and since we measure the temperature, it makes sense to tell Zabbix that the Units are in degree celsius.
- Our first item is ready so you can click the Add button at the bottom.
Last thing that we have to change is in the
zabbix_server.conffile. Here we have to uncommentStartIPMIPollers=0and change the0in a value high enough to the number of IPMI devices that we want to monitor. - When this is done, restart the Zabbix server which can be done with:
service zabbix-server restart.Tip
Passwords and pass phrases should not be shown in the frontend so please remind Zabbix about this by voting on this issue!
https://support.zabbix.com/browse/ZBXNEXT-2461.
It is best to open the IPMI with the latest firmware available if possible. Your IPMI device should at least support IPMI v2.0.
Getting IPMI to work is not too difficult but we need to make sure that our server is compiled with OpenIPMI support and that all packages are installed with a version of at least 2.0.14.
By default Zabbix is not configured to start any IPMI pollers, so in our server configuration file, we need to make sure that the IPMI pollers option is active and that enough pollers are set to monitor our IPMI devices. Don't forget to restart the server afterwards.
The IPMI device itself needs to have support for IPMI v2.0. Zabbix needs a user with read access on the IPMI so that it can read the data from the IPMI interface.
In Zabbix we need to make sure that on the host we add an extra interface for IPMI.
In the host tab of our server we need to add an IPMI interface here we need to configure the correct IP address and port.
Zabbix has reported that the OpenIPMI version 2.0.7 is broken and that at least version 2.0.14 is needed to get a working version.
It is possible that your network card also supports IPMI. In this case there is no extra network card and you just have to fill in the same IP address for the IPMI interface.
More sensors can be found by placing Zabbix in debug level 4 and looking for the reading_type parameter. More information about sensors can be found in the IPMI specifications.
http://www.intel.com/content/www/us/en/servers/ipmi/ipmi-specifications.html.
- As always check the latest Zabbix documentation for updates on IPMI monitoring:
https://www.zabbix.com/documentation/2.4/manual/config/items/itemtypes/ipmi