
So, we found out that a normal or passive agent waits for the server to connect, while an active agent connects to the server, grabs a list of items to check, and then reconnects to the server periodically to send in the data. This means that using one or the other kind of Zabbix agent item can impact performance. In general, active agents reduce the load on the Zabbix server because the server doesn't have to keep a list of what and when to check. Instead, the agent picks up that task and reports back to the server. But you should evaluate each case separately: if you only have a few items per host that you monitor very rarely (the update interval is set to a large value), converting all agents to active ones that retrieve the item list more often than the items were previously checked won't improve Zabbix server performance.
Note
It is important to remember that you can use a mixture of various items against a single host. As we just saw, a single host can have normal or passive Zabbix agent items, active Zabbix agent items, and simple checks assigned. This allows you to choose the best fit for monitoring every characteristic to ensure the best connectivity and performance and the least impact on the network and the monitored host. And that's not all yet—we'll explore several additional item types, which again can be mixed with the ones we already know for a single configured host.
Zabbix key parameters are comma-delimited and enclosed in square brackets. This means that any other character can be used in the parameters as is. If your parameters include commas or square brackets, they will have to be in quote marks. Here are a few examples:
key[param1,param2]: This key has two parameters,param1andparam2key["param1,param2"]: This key has one parameter,param1andparam2key[param1[param2]: This is an invalid keykey['param1,param2']: This key has two parameters,'param1andparam2'
What's up with the last one ? Well, Zabbix item keys are not shell-interpreted. Zabbix specifically supports double quotes for key parameter quoting. Single quotes are treated like any other character.
While we're working with items, let's explore some more tricks. Go to Configuration | Hosts, click on Items next to Another host, and then click on Incoming traffic on interface eth0 in the NAME column. In the item-editing form, click on the Clone button at the bottom. In the new form, modify the Key field so that it reads net.if.in[lo], and then click on the Add button at the bottom.
You might notice it right away, or go to Monitoring | Latest data and look at the list. Despite the fact that we only modified the key, the item name was updated accordingly as well:
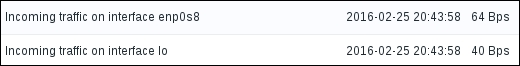
That's what the $1 part in the item Name field is doing. It's working like a common positional parameter, taking the first parameter of the item key. If we had more parameters, we could access those for inclusion in the name with $2, $3, and so on. This is mostly useful in cases where you want to create several items that monitor different entities so that when cloning the items, you have to change only a single instance of the identifier. It's easier than it seems to miss some change when there are multiple locations, thus creating items with mismatched configuration.
Now that we have some more items configured, it's worth looking at another monitoring view. While we spent most of our time in Monitoring | Latest data, this time, navigate to Monitoring | Overview. The Type dropdown in the upper-right corner currently lists Triggers, which does not provide a very exciting view for us: we only have a single trigger created. But we did create several items, so switch this dropdown to Data:
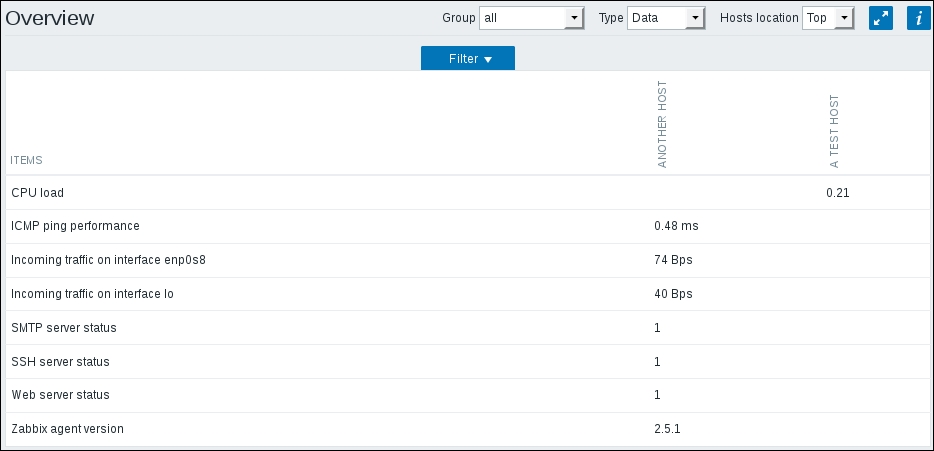
This time, the overview page is a bit more interesting: we can see which hosts have which items and item values.
Now this looks quite good—we can see all of the monitored data in a compact form. Those 1 results that denote the status for various servers—what do they mean? Was 1 for a running state, or was it an error, like with exit codes? They surely aren't intuitive enough, so let's try to remedy that. Go to Configuration | Hosts, and click on Items for Another host. Select all three server status items (SMTP, SSH, and Web), and then look at the buttons at the bottom of the item list:
This time, we will want to make a single change for all the selected items, so the second button from the right looks like what we need—it says Mass update. Click on it:
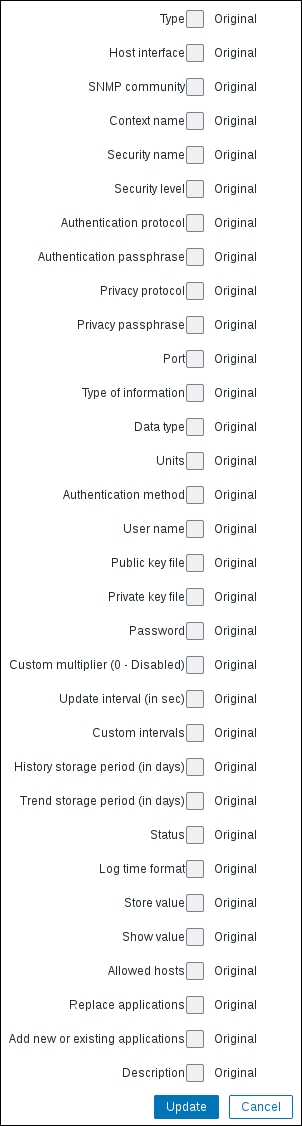
Now that's an interesting screen—it allows us to change some parameters for multiple items at once. While doing that, only changes that are marked and specified are performed, so we can change some common values for otherwise wildly differing items. It allows us to set things such as the Update interval or any other parameter together for the selected items.
This time, we are interested in only one value—the one that decides how the value is displayed to us. Mark the checkbox next to the Show value entry to see the available options.
Looks like somebody has already defined entries here, but let's find out what it actually means before making a decision. Click on the Show value mappings link to the right on the same line:
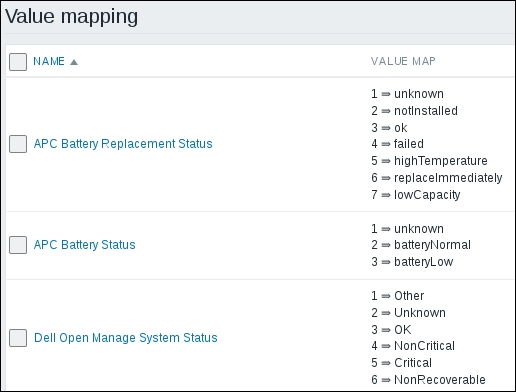
Looking at the list, we can see various names, each of them having a list of mapped references. Look at the NAME column, where the predefined entries have hints about what they are good for. You can see UPS-related mappings, generic status/state, SNMP, and Windows service-related mappings. The VALUE MAP column shows the exact mappings that are assigned to each entry. But what exactly are they? Looking at the entries, you can see things such as 0 => Down or 1 => Up. Data arriving for an item that has a value mapping assigned will expose the descriptive mappings. You are free to create any mapping you desire. To create a new category of mapped data, you need to use the button in the upper-right corner called Create value map. We won't do that now, because one of the available mappings covers our needs quite well. Look at the entries—remember the items we were curious about? They were monitoring a service and they used 1 to denote a service that is running and 0 to denote a service that is down. Looking at the list, we can see an entry, Service state, which defines 0 as Down and 1 as Up—exactly what we need. Well, that means we don't have to create or modify any entries, so simply close this window.
Back in the mass-update screen, recall the mapping entries we just saw and remember which entry fit our requirements the best. Choose Service state from the dropdown for the only entry whose checkbox we marked—Show value:
When you are done, click on the Update button. This operation should complete successfully. You can click on the Details control in the upper-left corner to verify that all three items we intended were updated.
Let's see how our change affected information display. Configured and assigned value mappings are used in most Zabbix frontend locations where it makes sense. For example, let's visit that old friend of ours, Monitoring | Latest data. Take a close look at the various server status entries—Zabbix still shows numeric values for the reference, but each has conveniently listed an appropriate "friendly name" mapped value:
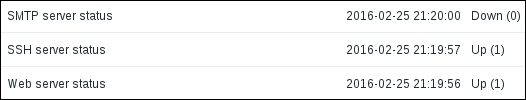
We have currently stopped the SMTP server to verify whether both 1 => Up and 0 => Down mappings work—as we can see, they do. Value mapping will be useful for returned data that works like code values—service states, hardware states (such as batteries), and other similar monitored data. We saw some predefined examples in the value-mapping configuration screen before, and you are free to modify or create new mappings according to your needs.
Value mapping can be used for integers, decimal values (floats), and strings. One use case for strings could be the mapping of different backup levels that a backup software might return:
I => IncrementalD => DifferentialF => Full
Navigate back to Monitoring | Overview and again, look at the various server status entries for ANOTHER HOST:
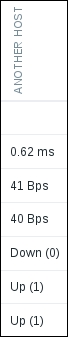
While value mapping doesn't seem too useful when you have to remember a single monitored characteristic with only two possible states, it becomes very useful when there are many different possible states and many possible mappings so that in most locations, you will have a quick hint about what each numeric value means and you are always free to invent your own mappings for custom-developed solutions.
We previously configured units for some items, using values such as B or ms. While the effect was visible in the monitoring section quite easily, there are some subtle differences in the handling of different units.
Units is a freeform field. You can type anything in there, but some units will change their behavior when data is displayed:
- B/Bps: By default, when applying K, M, G, T and other unit prefixes, Zabbix will use a multiplier of 1,000. If the unit is set to B or Bps, the multiplier used will be changed to 1,024
- s: An incoming value in seconds will be translated to a human-readable format
- uptime: An incoming value in seconds will be translated to a human-readable format
- unixtime: An incoming Unix timestamp will be translated to a human-readable format
Interestingly, for our ICMP ping item, we did not use any of these; we used ms instead. The reason is that in certain cases of a very small roundtrip, a value in seconds might be too small to properly store in the Zabbix database schema. By applying the multiplier of 1,000 in the item configuration, we converted the incoming value in seconds to milliseconds, which should never exceed the limits of the database schema. One downside would be that if a ping takes a long time, the value will not be displayed in seconds—we will have to figure it out from the millisecond value.
Another item property that we just briefly discussed was custom intervals. Most item types have their intervals configurable, which determines how often the item values should be collected. But what if we would like to change this interval based on the day of the week or the time of day? That is exactly what custom intervals enable us to do. There are two modes for custom intervals:
- Flexible intervals
- Custom scheduling
Flexible intervals override the normal interval for the specified time. For example, an item could collect values every 60 seconds, but that item might not be important during the weekend. In that case, a flexible interval could be added with an interval of 3600 and time specification of 6-7,00:00-24:00. During Saturdays and Sundays, this item would only be checked once an hour:
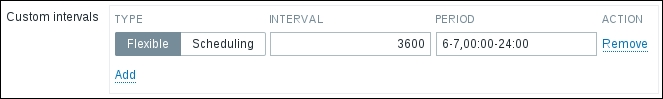
Days are represented with the numbers 1-7 and a 24-hour clock notation of HH:MM-HH:MM is used.
It is also possible to set the normal interval to 0 and configure flexible intervals. In this case, the item will only be checked at the times specified in the flexible intervals. This functionality can be used to check some item on a specific weekday only or even to simulate a crude scheduler. If an item is added with a normal interval of 0, a flexible interval of 60 seconds, and a time specification of 1,09:00-09:01, this item will be checked on Monday morning at 9 o'clock.
Tip
Overlapping flexible intervals
If two flexible intervals with different values overlap, during the overlap period, the smallest value is used. For example, if flexible intervals with periods 1-5,00-24:00 and 5-6,12:00-24:00 are added to the same item, during Friday, from 12:00 to 24:00, the one that has the smallest interval will be used.
The example of having a flexible interval of 1 minute works, but it's not very precise. For more exact timing, the other custom interval type can be used: scheduling. This enables you to obtain item values at an exact time. It also has one major difference from flexible intervals. Flexible intervals change how an item is polled, but custom scheduling does not change the existing polling. Scheduled checks are executed in addition to the normal or flexible intervals.
It may sound a lot like crontab, but Zabbix custom scheduling uses its own syntax. The time prefix is followed by a filter entry. Multiple time prefix and filter values are concatenated, going from the biggest to the smallest. The supported time prefixes are:
md: month dayswd: weekdaysh: hoursm: minutess: seconds
For example, an entry of m13 will schedule this item to be polled every hour at the beginning of minute 13. If it is combined with a weekday specification as wd3m13, it will be polled every hour at the beginning of minute 13 on Wednesdays only. Changing the weekday reference to the month day—or date—reference as md13m13 would make this item be polled every hour at the beginning of minute 13 on the thirteenth day only.
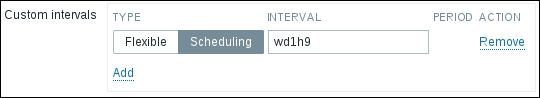
The example of polling the item on Monday morning at 09:00 we looked at before would be wd1h9:
The filter can also be a range. For example, polling an item at 09:00 on Monday, Tuesday, and Wednesday would be done as wd1-3h9.
At the end of the filter, we can also add a step through a slash. For example, wd1-5h6-10/2 would poll the item from Monday to Friday, starting at 06:00 every other hour until 10:00. The item would get polled at 06:00, 08:00 and 10:00. To make an item be polled every other hour all day long on all days, the syntax of h/2 can be used.
Multiple custom intervals may also be specified by separating them with a semicolon—wd1-5/2 and wd1;wd3;wd5 would both poll an item at the beginning of Monday, Wednesday, and Friday.
Looking at the same overview screen, the data seems easier to understand with textual hints provided for previously cryptic numeric values, but there's still a bit of not-so-perfect displaying. Notice the dashes displayed for the CPU load item for Another host and all other values for A test host. We didn't create corresponding items on both hosts, and item data is displayed here, which means missing items should be created for each host to gather the data. But recreating all items would be very boring. Luckily, there's a simple and straightforward solution to this problem.
Go to Configuration | Hosts and click on Items next to A test host. We had only a single item configured for this host, so mark the checkbox next to this item. Let's look at the available buttons at the bottom of the list again:
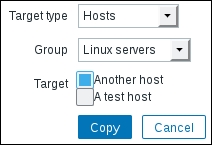
This time, we don't want to update selected items, but copy them to another host, so click on the Copy button. We want to copy these items to a specific host, so choose Hosts in the Target type dropdown and select Linux servers in the Group dropdown, which should leave us with a short list of hosts. We are copying from A test host to Another host; mark the checkbox next to the Another host entry and click on the Copy button:
When the operation has completed, change the Host filter field (expand the filter if it is closed) to Another host, and then click on Filter below the filter itself. Notice how the CPU load item has appeared in the list. This time, mark all the items except CPU load, because that's the only item A test host has. You can use the standard range selection functionality here—mark the checkbox next to the ICMP ping performance item (the first item in the range we want to select), hold down Shift on the keyboard, and click on the checkbox next to the Zabbix agent version (the last item in the range we want to select). This should select all the items between the two checkboxes we clicked on.
Tip
Using Shift and clicking works to both select and unselect arbitrary entry ranges, including items, hosts, triggers, and other entries in the Zabbix frontend. It works both upwards and downwards. The result of the action depends on the first checkbox marked—if you select it, the whole range will be selected, and vice versa.
With those items selected, click on Copy below the item list. Choose Hosts in the Target type dropdown, choose Linux servers in the Group dropdown, mark only the checkbox next to A test host, and click on Copy. After that, click on the Details link in the upper-right corner. Notice how all the copied items are listed here. Let's take another look at Monitoring | Overview:
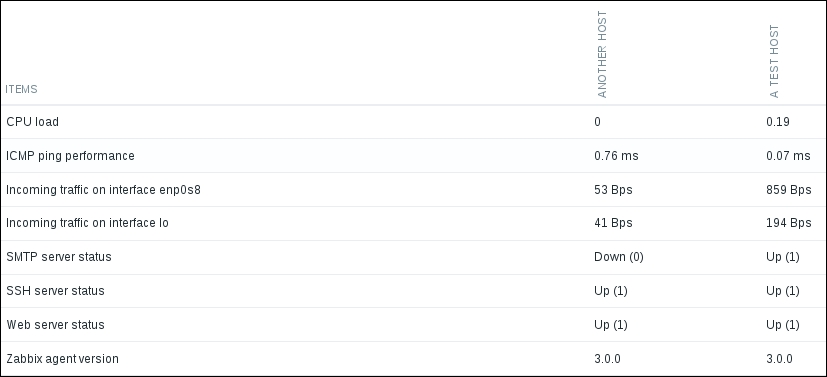
Great, that's much better! We can see all the data for the two hosts, with the numeric status nicely explained. Basically, we just cross-copied items that did not exist on one host from the other one.
But it only gets better—mouseover to the displayed values. Notice how the chosen row is highlighted. Let's click on one of the CPU load values:
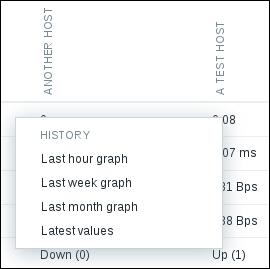
As you can see, the overview screen not only shows you data in a tabular form, it also allows quick access to common timescale graphs and the Latest values for the item. Feel free to try that out.
When you have looked at the data, click on one of the Zabbix agent version values:
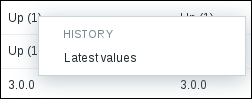
Notice how this time there are no entries for graphs. Remember: graphs were only available for numeric data, so Monitoring | Latest data and these overview screen pop-up menus offer the value history only.