
Zabbix is a fairly lightweight monitoring application that is able to manage thousands of items with a single-server installation. However, the presence of thousands of monitored hosts, a complex network topology, or the necessity to manage different geographical locations with intermittent, slow, or faulty communications can all show the limits of a single-server configuration. Likewise, the necessity to move beyond a monolithic scenario towards a distributed one is not necessarily a matter of raw performance, and, therefore, it's not just a simple matter of deciding between buying many smaller machines or just one big, powerful one. Many DMZs and network segments with a strict security policy don't allow two-way communication between any hosts on either side, so it is impossible for a Zabbix server to communicate with all the agents on the other side of a firewall. Different branches in the same company or different companies in the same group may need some sort of independence in managing their respective networks, while also needing some coordination and higher-level aggregation of monitored data. Different labs of a research facility may find themselves without a reliable network connection, so they may need to retain monitored data for a while and then send it asynchronously for further processing.
Thanks to its distributed monitoring features, Zabbix can thrive in all these scenarios and provide adequate solutions, whether the problem is about performance, network segregation, administrative independence, or data retention in the presence of faulty links.
While the judicious use of Zabbix agents could be considered from a point of view to be a simple form of distributed monitoring, in this chapter, we will concentrate on Zabbix's supported distributed monitoring mode with proxies. In this chapter, you will learn how to set up, size, and properly configure a Zabbix proxy.
There will also be considerations about security between proxies and the Zabbix server communication so that, by the end of this chapter, you will have all the information you need to apply Zabbix's distributed features to your environment.
A Zabbix proxy is another member of the Zabbix suite of programs that sits between a full-blown Zabbix server and a host-oriented Zabbix agent. Just as with a server, it's used to collect data from any number of items on any number of hosts, and it can retain that data for an arbitrary period of time, relying on a dedicated database to do so. Just as with an agent, it doesn't have a frontend and is managed directly from the central server. It also limits itself to data collection without triggering evaluations or actions.
All these characteristics make the Zabbix proxy a simple, lightweight tool to deploy if you need to offload some checks from the central server or if your objective is to control and streamline the flow of monitored data across networks (possibly segregated by one or more firewalls) or both.
A basic distributed architecture involving Zabbix proxies would look as follows:

By its very nature, a Zabbix proxy should run on a dedicated machine, which is different than the main server. A proxy is all about gathering data; it doesn't feature a frontend, and it doesn't perform any complex queries or calculations; therefore, it's not necessary to assign a powerful machine with a lot of CPU power or disk throughput. In fact, a small, lean hardware configuration is often a better choice; proxy machines should be lightweight enough—not only to mirror the simplicity of the software component, but also because they should be an easy and affordable way to expand and distribute your monitoring architecture without creating too much impact on deployment and management costs.
A possible exception to the small, lean, and simple guideline for proxies can arise if you end up assigning hundreds of hosts with thousands of monitored items to a single proxy. In that case, instead of upgrading the hardware to a more powerful machine, it's often cheaper to just split up the hosts into different groups and assign them to different smaller proxies. In most cases, this would be the preferred option as you are not just distributing and evening out the load, but you are also considering the possibility of huge data loss if a single machine charged with the monitoring of a large portion of your network were to go down for any reason. Consider using small, lightweight embedded machines as Zabbix proxies. They tend to be cheap, easy to deploy, reliable, and quite frugal when it comes to power requirements. These are ideal characteristics for any monitoring solution that aims to leave as little a footprint as possible on the monitored system. There is one other consideration: if you have a very segregated network, that is perhaps even distributed in many different geographical locations, it is better to consider a very good persistent database on the back of it. This reason is driven by the fact that a network outage, which can endure for a considerable period of time, will force the proxy to preserve a considerable amount of data for an important period of time, and here, if the proxy goes down, it can be a serious problem.
That said, quantifying the period of time that the proxy needs to survive without any connectivity with the server can be quite complex as it depends on two particular factors: the number of the hosts that are monitored by a particular proxy, and, moreover, the number of items or acquired metrics that the proxy needs to store in its local database. Here, it is easy to understand that this kind of thinking will drive the database choice. Whether the proxy is on your local network or not, the decision will go in favor of a lightweight and performing database, such as SQLite3; otherwise, we will be obliged to choose a different kind of database that can maintain data for a long period of time and can be more crash tolerant than MySQL or PostgreSQL.
A Zabbix proxy is compiled together with the main server if you add --enable-proxy to the compilation options. The proxy can use any kind of database backend, just as the server does, but if you don't specify an existing DB, it will automatically create a local SQLite database to store its data. If you intend to rely on SQLite, just remember to add --with-sqlite3 to the options as well.
When it comes to proxies, it's usually advisable to keep things light and simple as much as we can; of course, this is valid only if the network design permits us to take this decision. A proxy DB will just contain configuration and measurement data that, under normal circumstances, is almost immediately synchronized with the main server. Dedicating a full-blown database to it is usually overkill, so unless you have very specific requirements, the SQLite option will provide the best balance between performance and ease of management.
If you didn't compile the proxy executable the first time you deployed Zabbix, just run configure again with the options you need for the proxies:
$ ./configure --enable-proxy --enable-static --with-sqlite3 --with-net-snmp --with-libcurl --with-ssh2 --with-openipmi
Compile everything again using the following command:
$ make
The only files you need to take and copy over to the proxy machine are the proxy executable and its configuration file. The $PREFIX variable should resolve to the same path you used in the configuration command (/usr/local by default):
# cp src/zabbix_proxy/zabbix_proxy $PREFIX/sbin/zabbix_proxy
# cp conf/zabbix_proxy.conf $PREFIX/etc/zabbix_proxy.conf
Next, you need to fill out relevant information in the proxy's configuration file. The default values should be fine in most cases, but you definitely need to make sure that the following options reflect your requirements and network status:
ProxyMode=0
This means that the proxy machine is in an active mode. Remember that you need at least as many Zabbix trappers on the main server as the number of proxies you deploy. Set the value to 1 if you need or prefer a proxy in the passive mode. See the Understanding the Zabbix monitoring data flow section for a more detailed discussion on proxy modes. The following code captures this discussion:
Server=n.n.n.n
This should be the IP number of the main Zabbix server or of the Zabbix node that this proxy should report to:
Hostname=Zabbix proxy
This must be a unique, case-sensitive name that will be used in the main Zabbix server's configuration to refer to the proxy:
LogFile=/tmp/zabbix_proxy.log
LogFileSize=1
DebugLevel=2
If you are using a small, embedded machine, you may not have much disk space to spare. In that case, you may want to comment all the options regarding the log file and let syslog send the proxy's log to another server on the Internet:
# DBHost=
# DBSchema=
# DBUser=
# DBPassword=
# DBSocket=
# DBPort=
We need now create the SQLite database; this can be done with the following commands:
$ mkdir –p /var/lib/sqlite/
$ sqlite3 /var/lib/sqlite/zabbix.db < /usr/share/doc/zabbix-proxy-sqlite3-2.4.4/create/schema.sql
Now, in the DBName parameter, we need to specify the full path to our SQLite database:
DBName=/var/lib/sqlite/zabbix.db
The proxy will automatically populate and use a local SQLite database. Fill out the relevant information if you are using a dedicated, external database:
ProxyOfflineBuffer=1
This is the number of hours that a proxy will keep monitored measurements if communications with the Zabbix server go down. Once the limit has been reached, the proxy will housekeep away the old data. You may want to double or triple it if you know that you have a faulty, unreliable link between the proxy and server.
CacheSize=8M
This is the size of the configuration cache. Make it bigger if you have a large number of hosts and items to monitor.
There is a set of commands that you can run against the proxy to change runtime parameters. This set of commands is really useful if your proxy is struggling with items, in the sense that it is taking longer to deliver the items and maintain our Zabbix proxy up and running.
You can force the configuration cache to get refreshed from the Zabbix server with the following:
$ zabbix_proxy -c /usr/local/etc/zabbix_proxy.conf -R config_cache_reload
This command will invalidate the configuration cache on the proxy side and will force the proxy to ask for the current configuration to our Zabbix server.
We can also increase or decrease the log level quite easily at runtime with log_level_increase and log_level_decrease:
$ zabbix_proxy -c /usr/local/etc/zabbix_proxy.conf –R log_level_increase
This command will increase the log level for the proxy process; the same command also supports a target that can be PID, process type or process type, number here. What follow are a few examples.
Increase the log level of the three poller process:
$ zabbix_proxy -c /usr/local/etc/zabbix_proxy.conf -R log_level_increase=poller,3
Increase the log level of the PID to 27425:
$ zabbix_proxy -c /usr/local/etc/zabbix_proxy.conf -R log_level_increase=27425
Increase or decrease the log level of icmp pinger or any other proxy processes with:
$ zabbix_proxy -c /usr/local/etc/zabbix_proxy.conf -R log_level_increase="icmp pinger"
zabbix_proxy [28064]: command sent successfully
$ zabbix_proxy -c /usr/local/etc/zabbix_proxy.conf -R log_level_decrease="icmp pinger"
zabbix_proxy [28070]: command sent successfully
We can quickly see the changes reflected in the log file here:
28049:20150412:021435.841 log level has been increased to 4 (debug)
28049:20150412:021443.129 Got signal [signal:10(SIGUSR1),sender_pid:28034,sender_uid:501,value_int:770(0x00000302)].
 28049:20150412:021443.129 log level has been decreased to 3 (warning)
Deploying a Zabbix proxy using the RPM is a very simple task. Here, there are fewer steps required as Zabbix itself distributes a prepackaged Zabbix proxy that is ready to use.
What you need to do is simply add the official Zabbix repository with the following command that must be run from root:
$ rpm –ivh http://repo.zabbix.com/zabbix/2.4/rhel/6/x86_64/zabbix-2.4.4-1.el6.x86_64.rpm
Now, you can quickly list all the available zabbix-proxy packages with the following command, again from root:
$ yum search zabbix-proxy
============== N/S Matched: zabbix-proxy ================
zabbix-proxy.x86_64 : Zabbix Proxy common files
zabbix-proxy-mysql.x86_64 : Zabbix proxy compiled to use MySQL
zabbix-proxy-pgsql.x86_64 : Zabbix proxy compiled to use PostgreSQL
zabbix-proxy-sqlite3.x86_64 : Zabbix proxy compiled to use SQLite3
In this example, the command is followed by the relative output that lists all the available zabbix-proxy packages; here, all you have to do is choose between them and install your desired package:
$ yum install zabbix-proxy-sqlite3
Now, you've already installed the Zabbix proxy, which can be started up with the following command:
$ service zabbix-proxy start
Starting Zabbix proxy:                               [  OK  ]
That done, if you're using iptables, it is important to add a rule to enable incoming traffic on the 10051 port (that is the standard Zabbix proxy port) or, in any case, against the port that is specified in the configuration file:
ListenPort=10051
To do that, you simply need to edit the iptables configuration file /etc/sysconfig/iptables and add the following line right on the head of the file:
-A INPUT -m state --state NEW -m tcp -p tcp --dport 10051 -j ACCEPT
Then, you need to restart your local firewall from root using the following command:
$ service iptables restart
The log file is generated at /var/log/zabbix/zabbix_proxy.log:
$ tail -n 40 /var/log/zabbix/zabbix_proxy.log
 62521:20150411:003816.801 **** Enabled features ****
 62521:20150411:003816.801 SNMP monitoring:       YES
 62521:20150411:003816.801 IPMI monitoring:       YES
 62521:20150411:003816.801 WEB monitoring:        YES
 62521:20150411:003816.801 VMware monitoring:     YES
 62521:20150411:003816.801 ODBC:                  YES
 62521:20150411:003816.801 SSH2 support:          YES
 62521:20150411:003816.801 IPv6 support:          YES
 62521:20150411:003816.801 **************************
 62521:20150411:003816.801 using configuration file: /etc/zabbix/zabbix_proxy.conf
As you can quickly spot, the default configuration file is located at /etc/zabbix/zabbix_proxy.conf.
The only thing that you need to do is make the proxy known to the server and add monitoring objects to it. All these tasks are performed through the Zabbix frontend by just clicking on Admin | Proxies and then Create. This is shown in the following screenshot:

Please take care to use the same Proxy name that you've used in the configuration file, which, in this case, is ZabbixProxy; you can quickly check with:
$ grep Hostname= /etc/zabbix/zabbix_proxy.conf
# Hostname=
Hostname=ZabbixProxy
Note how, in the case of an Active proxy, you just need to specify the proxy's name as already set in zabbix_proxy.conf. It will be the proxy's job to contact the main server. On the other hand, a Passive proxy will need an IP address or a hostname for the main server to connect to, as shown in the following screenshot:

See the Understanding the monitoring data flow with proxies section for more details. You don't have to assign hosts to proxies at creation time or only in the proxy's edit screen. You can also do that from a host configuration screen, as follows:

One of the advantages of proxies is that they don't need much configuration or maintenance; once they are deployed and you have assigned some hosts to one of them, the rest of the monitoring activities are fairly transparent. Just remember to check the number of values per second that every proxy has to guarantee, as expressed by the Required performance column in the proxies' list page:

Values per second (VPS) is the number of measurements per second that a single Zabbix server or proxy has to collect. It's an average value that depends on the number of items and the polling frequency for every item. The higher the value, the more powerful the Zabbix machine must be.
Depending on your hardware configuration, you may need to redistribute the hosts among proxies or add new ones if you notice degraded performances coupled with high VPS.
Nowadays, from Zabbix 2.4 the support for nodes has been discontinued, and the only distributed scenario available is limited to the Zabbix proxy; those proxies now play a truly critical role. Also, with proxies deployed in many different geographic locations, the infrastructure is more subject to network outages. That said, there is a case to consider which database we want to use for those critical remote proxies.
Now, SQLite3 is a good product as a standalone and lightweight setup, but if, in our scenario, the proxy we've deployed needs to retain a considerable amount of metrics, we need to consider the fact that SQLite3 has certain weak spots:
- The atomic-locking mechanism on SQLite3 is not the most robust ever
- SQLite3 suffers during high-volume writes
- SQLite3 does not implement any kind of user authentication mechanism
Apart from the point that SQLite3 does not implement any kind of authentication mechanism, the database files are created with the standard unmask, due to which, they are readable by everyone. In the event of a crash during high load it is not the best database to use.
Here is an example of the sqlite3 database and how to access it using a third-party account:
$ ls -la /tmp/zabbix_proxy.db
-rw-r--r--. 1 zabbix zabbix 867328 Apr 12 09:52 /tmp/zabbix_proxy.db
]# su - adv
[adv@localhost ~]$ sqlite3 /tmp/zabbix_proxy.db
SQLite version 3.6.20
Enter ".help" for instructions
Enter SQL statements terminated with a ";"
sqlite>
Then, for all the critical proxies, it is advisable to use a different database. Here, we will use MySQL, which is a well-known database.
To install the Zabbix proxy with MySQL, if you're compiling it from source, you need to use the following command line:
$ ./configure --enable-proxy --enable-static --with-mysql --with-net-snmp --with-libcurl --with-ssh2 --with-openipmi
This should be followed by the usual:
$ make
Instead, if you're using the precompiled rpm, you can simply run from root:
$ yum install zabbix-proxy-mysql
Now, you need to start up your MySQL database and create the required database for your proxy:
$ mysql -uroot -p<password>
$ create database zabbix_proxy character set utf8 collate utf8_bin;
$ grant all privileges on zabbix_proxy.* to zabbix@localhost identified by '<password>';
$ quit;
$ mysql -uzabbix -p<password> zabbix_proxy < database/mysql/schema.sql
If you've installed using rpm, the previous command will be:
$ mysql -uzabbix -p<password> zabbix_proxy < /usr/share/doc/zabbix-proxy-mysql-2.4.4/create/schema.sql/schema.sql
Now, we need to configure zabbix_proxy.conf and add the proper value to those parameters:
DBName=zabbix_proxy
DBUser=zabbix
DBPassword=<password>
Please note that there is no need to specify DBHost as the socket used for MySQL.
Finally, we can start up our Zabbix proxy with the following command from root:
$ service zabbix-proxy start
Starting Zabbix proxy:                                     [  OK  ]
Before explaining the monitoring data flow of our Zabbix proxies, it is important to have at least an idea of the standard Zabbix monitoring data flow.
We can have at least four different kinds of data sources that can deliver items to the Zabbix server:
- The Zabbix agent
- The Zabbix sender
zabbix_sendcommand - Custom-made third-party agents
- Zabbix proxy
The following diagram represents the simplified data flow followed by a Zabbix item:
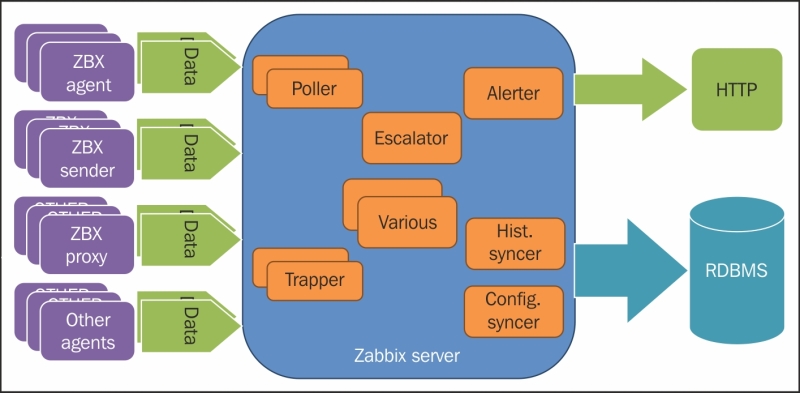
Be aware that this picture is a simplified, readable version of the full data flow, and that it includes many other small components that are summarized on the picture by the block called various. Then, basically on the left-hand side, we have all our possible data sources, and on the right-hand side, we have the GUI that represents the Zabbix web interface and, of course, the database that stores all the items. Now, in the next section, we will see how the dataflow on the Zabbix proxy detail is implemented.
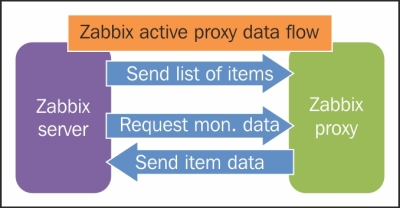
Zabbix proxies can operate in two different modes, active and passive. An active proxy, which is the default setup, initiates all connections to the Zabbix server, both to retrieve configuration information on monitored objects and to send measurements back to be further processed. You can tweak the frequency of these two activities by setting the following variables in the proxy configuration file:
ConfigFrequency=3600

DataSenderFrequency=1
Both the preceding values are in seconds. On the server side, in the zabbix_server.conf file, you also need to set the value of StartTrappers= to be higher than the number of all active proxies you have deployed. The trapper processes will have to manage all incoming information from proxies, nodes, and any item configured as an active check. The server will fork extra processes as needed, but it's advisable to pre-fork as many processes as you already know the server will use.
Back on the proxy side, you can also set HeartbeatFrequency so that after a predetermined number of seconds, it will contact the server even if it doesn't have any data to send. You can then check on the proxy availability with the following item, where proxy name, of course, is the unique identifier that you assigned to the proxy during deployment:
zabbix[proxy, "proxy name", lastaccess]
The item, as expressed, will give you the number of seconds since the last contact with the proxy, a value that you can then use with the appropriate triggering functions. A good starting point to fine-tune the optimal heartbeat frequency is to evaluate how long you can afford to lose contact with the proxy before being alerted, and consider that the interval is just over two heartbeats. For example, if you need to know whether a proxy is possibly down in less than 5 minutes, set the heartbeat frequency to 120 seconds and check whether the last access time was over 300 seconds. The following diagram depicts this discussion aptly:

An active proxy is more efficient at offloading computing duties from the server as the latter will just sit idle, waiting to be asked about changes in configuration or to receive new monitoring data. The downside is that proxies will often be deployed to monitor secure networks, such as DMZs, and other segments with strict outgoing traffic policies. In these scenarios, it would be very difficult to obtain permission for the proxy to initiate contact with the server. And it's not just a matter of policies; DMZs are isolated as much as possible from internal networks for extremely good and valid reasons. On the other hand, it's often easier and more acceptable from a security point of view to initiate a connection from the internal network to a DMZ. In these cases, a passive proxy will be the preferred solution.
Connection- and configuration-wise, a passive proxy is almost the mirror image of the active version. This time, it's the server that needs to connect periodically to the proxy to send over configuration changes and to request any measurements the proxy may have taken. On the proxy configuration file, once you've set ProxyMode=1 to signify that this is a passive proxy, you don't need to do anything else. On the server side, there are three variables you need to check:
StartProxyPollers=:This represents the number of processes dedicated to manage passive proxies and should match the number of passive proxies you have deployed.
ProxyConfigFrequency=:The server will update a passive proxy with configuration changes for the number of seconds you have set in the preceding variable.
ProxyDataFrequency=:This is the interval, also in seconds, between two consecutive requests by the server for the passive proxy's monitoring measurements.
There are no further differences between the two modes of operation for proxies. You can still use the zabbix[proxy, "proxy name", lastaccess] item to check a passive proxy's availability, just as you did for the active one:
At the price of a slightly increased workload for the server, when compared to active proxies, a passive one will enable you to gather monitoring data from otherwise closed and locked-down networks. At any rate, you can mix and match active and passive proxies in your environment depending upon the flow requirements of specific networks. This way, you will significantly expand your monitoring solution both in its ability to reach every part of the network and in its ability to handle a large number of monitored objects, while at the same time keeping the architecture simple and easy to manage with a strong central core and many simple, lightweight yet effective satellites.
Since the proxy is the only component that allows us to split our Zabbix server workload and is also the only way that we have to split our network topology top-down, we need to keep the Zabbix proxy under our watchful eyes.
We've already seen how to produce an item to monitor them and their respective heartbeat; an this is not enough.
There are certain useful items that will help us, and all are contained in Template App Zabbix Proxy. It is important to have a look at it and definitely use it.
Unfortunately, there isn't an item that allows us to check how many items are still on the proxy queue to be sent.
This is the most obvious and critical check that you should have in place. This can be solved with the following query against the proxy database:
SELECT ((SELECT MAX(proxy_history.id) FROM proxy_history)-nextid) FROM ids WHERE field_name='history_lastid'
This query will return the number of items that the proxy still needs to send to the Zabbix server. Then, the simple way to run this query against a SQLite3 database is to add the following UserParameter on the proxy side:
UserParameter=zabbix.proxy.items.sync.remaining,/usr/bin/sqlite3 /path/to/the/sqlite/database "SELECT ((SELECT MAX(proxy_history.id) FROM proxy_history)-nextid) FROM ids WHERE field_name='history_lastid'" 2>&1
If you have to choose to use a more robust database behind your proxy, for instance MySQL, UserParameter will then be the following in the proxy agent configuration file:
UserParameter=zabbix.proxy.items.sync.remaining, mysql -u <your username here> -p'<your password here>' <dbname> -e 'SELECT ((SELECT MAX(proxy_history.id) FROM proxy_history)-nextid) FROM ids WHERE field_name=history_lastid' 2>&1
Now, all you need to do is set an item on the Zabbix server side, with a relative trigger associated with it, that will track how your proxy is freeing its queue. This item is shown in the next screenshot:
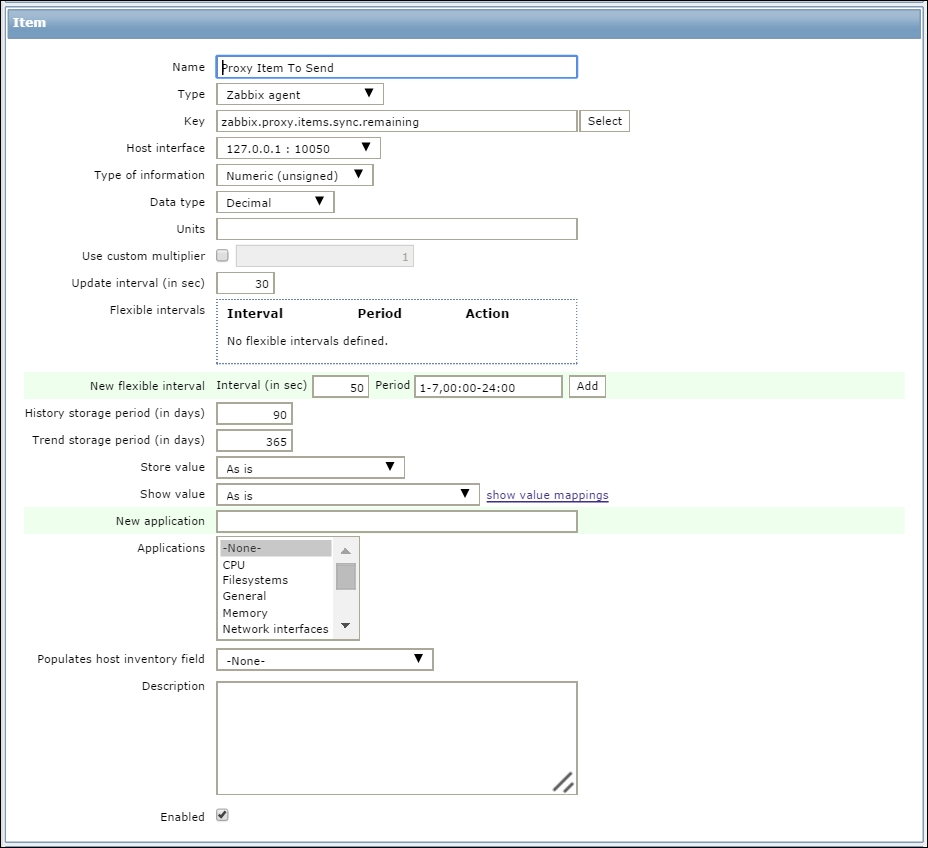
An example of the trigger that could be associated with this item can be:
{Hostname:zabbix.proxy.items.sync.remaining.min(10m)}>10000This trigger will go on fire when the number in queue reaches the length of 10,000 items to send, which is a reasonable number; anyway, here you need to adjust this particular item to the number of hosts monitored that you have behind your proxy and the number of items that your proxy is acquiring.