
We have now installed Zabbix, but it's not doing much—this is what we'd expect. Software that starts doing something on its own would probably be a bit undesirable, at least for now. The promise of Zabbix is to inform you about problems as soon as possible, preferably before your users and management notice them. But how do we get data, where do we place it, and how do we define what a problem is? We will try to quickly get Zabbix working and alerting us on a single monitored item, which is the most common scenario. Before we can tell Zabbix who to send notifications to, we will have to explore and use some basic Zabbix concepts. They are as follows:
- Navigating around the frontend
- Creating a host and item (the Zabbix term for a monitored metric)
- Looking at the gathered data and finding out how to get it graphed
- Defining a problem threshold with a trigger
- Telling Zabbix that it should send an e-mail when this threshold is exceeded
- Causing a problem in order to actually receive the notification
Although we have already looked at some data provided by the frontend, we should get a bit more familiar with it before attempting some more configuration tasks.
Configuration steps will be followed by verifying results in the Monitoring section. We will then explain some generic item terms used in Zabbix and their uses. Items, being the basis of information gathering, have a fair amount of configuration possibilities.
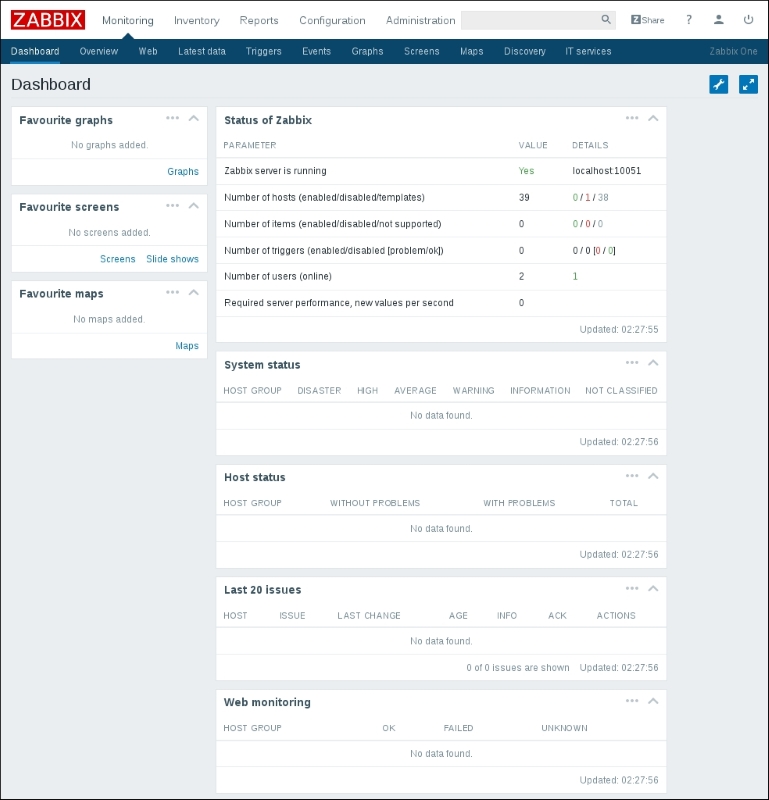
In your browser, open Zabbix's root URL (http://<server_ip_or_name>/zabbix), and log in again if you have been logged out. You should now see a pretty empty dashboard with little information:
Click on the entries of the top menu bar and observe how the lower menu bar shows subentries of the chosen category. Click on Configuration, and then click on Host groups in the second-level menu—here, all configured host groups are shown. You will be using these menus a lot, so in the future, we'll refer to the action we just performed as Configuration | Host groups. (Whenever you see such a notation, the first is the main category, and the second is the entry under it.)
As you can see in the following screenshot, there are five main categories, and they are as follows :

- Monitoring: This category contains most of the monitoring-related pages. You will be able to view data, problems, and graphs here.
- Inventory: Here, inventory data for monitored systems can be viewed.
- Reports: This section contains some simple reports.
- Configuration: Setting up everything related to the monitoring of systems, parameters, notification sending, and so on happens here.
- Administration: This section allows you to set up more of the Zabbix internals, including authentication methods, users, permissions, and global Zabbix configuration.
Before we venture deeper into these categories, it might be worth visiting the profile section—see the person-like icon in the upper-right corner:
Clicking on it should open your profile:
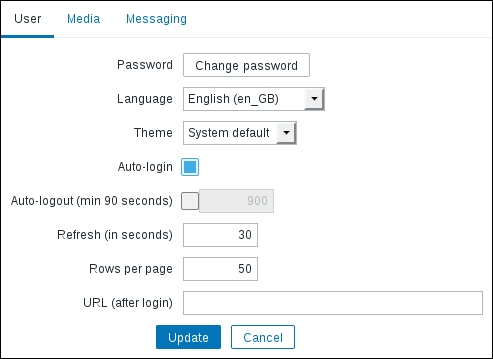
Here, you can set some options concerning your user account, for example, changing the password, the frontend language, or the frontend theme. As we will be using an English (en_GB) frontend, I suggested you to leave that at the default. Previous Zabbix versions shipped with four different themes, but that has been reduced in Zabbix 3.0; now, there are only the Blue and Dark themes. We'll stick with the default theme, but both of the themes shipped with Zabbix 3.0 seem to be visually pretty.
Notice that you can find out the user account you are currently connected as by moving the mouse cursor over the profile icon in the upper-right corner. A tooltip will show your username, as well as name and surname, as configured in the user profile. When you are not logged in, no profile icon is shown.
There are two options related to logging in: Auto-login, which will automatically log the user in using a cookie saved by their browser, and Auto-logout. By default, Auto-login should be enabled, and we will not change these options.
Note
At the time of writing this, any background operation in the frontend will reset the Auto-logout timer, essentially making it useless. You can follow the issue ZBX-8051 in the Zabbix issue tracker, described in more detail in Appendix B, Being Part of the Community.
We won't change the URL option at present, but we'll discuss the benefits of setting a custom default URL for a particular user later. The Refresh option sets the period in seconds after which some pages in the frontend will refresh automatically to display new data. It might be beneficial to increase this parameter for huge screens, which we do not yet have.
The Rows per page option will limit the amount of entities displayed at a time. In larger installations, it might be useful to increase it, but making it too large can negatively affect performance of the frontend.
Let's make another change here—switch over to the Messaging tab:
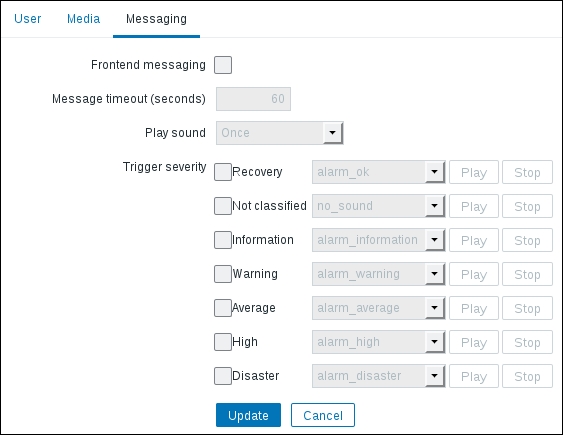
It allows you to configure frontend messages. For now, just mark the Frontend messaging option to enable them and change Message timeout (seconds) to 180. We will discuss what the various options do later in this chapter, when the messages start to appear.
After you have changed the theme and enabled frontend messages, click on the Update button.