
While many keys match between platforms, there's a whole category that is specific to Windows. Zabbix supports Windows' built-in metrics-gathering system, performance counters. People who are familiar with Windows probably know that these can be found at Control Panel | Administrative Tools | Performance in older versions of Windows and Administrative Tools | Performance Monitor in more recent versions, with a lot of counters to add. How exactly it operates depends on the Windows version again—in older versions we can click on the + icon in the child toolbar, or press Ctrl + I to see available counters:
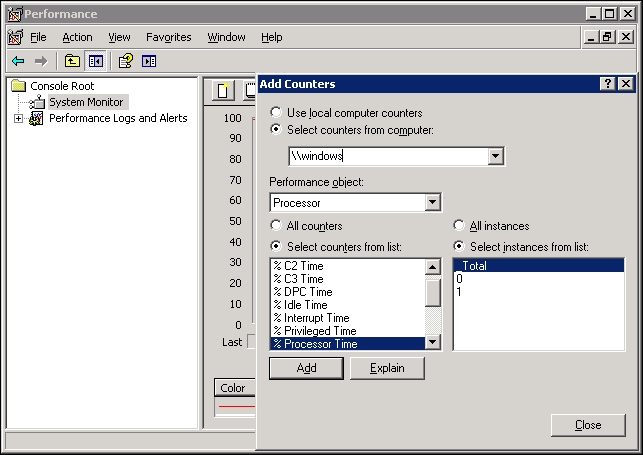
In this dialog, we can gather the information required to construct a performance counter string. First, the string has to start with a backslash, . The Performance object follows, in this case, Processor. Then we have to include the desired instance in parentheses, which makes our string so far Processor(_Total) (notice the leading underscore before Total). The counter string is finished by adding an individual counter string from the Select counters from list list box, again separated by a backslash. So the final performance counter string looks like this:
Processor(_Total)\% Idle Time
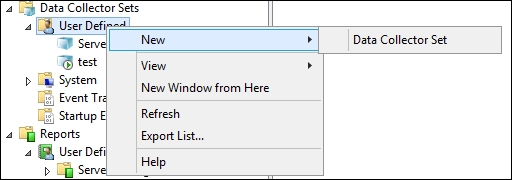
In recent Windows versions we expand Data Collector Sets, right-click on User Defined, and choose New | Data Collector Set:
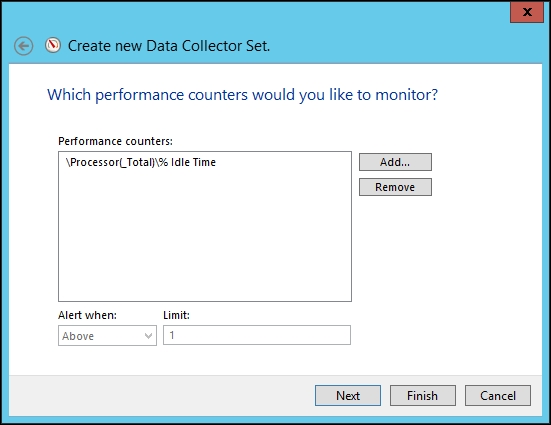
In the resulting window, enter a name for the data collector set, choose Create manually, and click on Next. Choose Performance Counter Alert, and click on Next again, then click on Add. Here we finally get to the performance counters—expand Processor and click on % Idle Time, then click on Add >>. Now click on OK to see the constructed performance counter string:
Now that we have constructed it, what do we do with it? Create an item, of course. Back in the frontend, navigate to Configuration | Hosts, click on Items next to the Windows host, and click on Create item. Fill in these values:
- Name:
CPU idle time, % - Key: This is where things get more interesting, although the principle is quite simple—the
perf_counterkey has to be used with the performance counter string like the one we constructed before as a parameter; thus, enterperf_counter[Processor(_Total)\% Idle Time]here - Type of information: Numeric (float)
- Units:
%
When you are done, click on the Add button at the bottom. This item should show us the total time all CPUs spend idling on the machine, so let's look at Monitoring | Latest data. We can see that the data is directly fetched from the built-in performance counter:
Looking at the list of available performance objects and corresponding counters in Windows, we can see many different metrics. Navigating this window is cumbersome at best, thanks to small widgets, no proper filtering or searching capabilities, and the fact that constructing the required string to be used as a key is a manual typing job, as entries can't be copied. Luckily there's a solution available—the command line utility typeperf.exe. To see how it can help us, execute:
C:zabbix>typeperf -qx > performance_counters.txt
This will direct all output of this command to be saved in the file performance_counters.txt. Open that file with a text editor and observe the contents. You'll see lots and lots of performance counter strings, covering various software and hardware information. There is no need to struggle with that clumsy dialog anymore; we can easily search for and copy these strings.
If you have a localized Windows installation, you have probably noticed by now that all performance counters are in the localized language, not in English. This becomes especially cumbersome to handle if you have to monitor several Windows machines with different locales configured for them. For example, a counter that on an English Windows installation is SystemProcesses would be SystèmeProcesses in a French one. Would it be possible to use some other, more universal method to refer to the performance counters? Indeed, it would; we can use numeric references, but first we have to find out what they are.
Launch regedit and look for the key HKEY_LOCAL_MACHINESOFTWAREMicrosoftWindows NTCurrentVersionPerflib. Under this key, you'll see one or more entries, with one being 009, which is the entry for the English language. Select this entry and pay attention to the Counter key, which has suspiciously similar contents to performance counter names. Expect to see something like this in an older version of Windows:
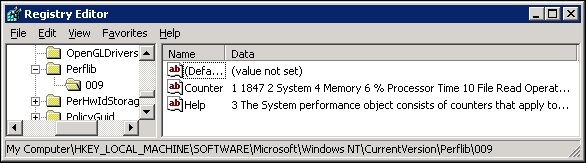
You would see something like this in a recent version:
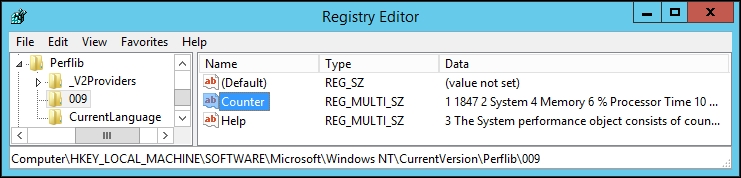
Double-click this value to see its contents in a somewhat more manageable form:
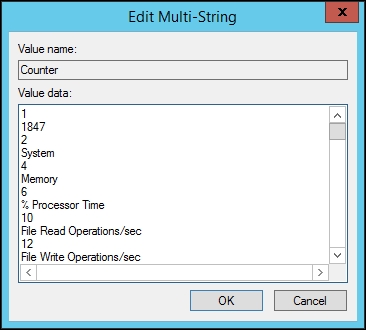
Each performance counter string can be translated to a number. But figuring out exact conversions in this tiny window is awfully hard, so let's copy all the contents and save them to a file, which we'll then be able to search—name it numeric.txt. To see how this works, let's translate the performance counter string we used before: Processor(_Total)\% Idle Time.
First we have to translate the performance object, Processor. While it is possible to search these contents in any text editor, it soon becomes cumbersome, especially if we have to translate lots of values. In that case we can turn to the basic GNU tools, such as grep, which you might have installed on the Windows machine—if not, copy this file over to the Zabbix server:
$ grep -B 1 "^Processor$" numeric.txt
This command will search for a line containing the string Processor exactly and will also output the line immediately before it, which contains the numeric ID of this performance object:
238
Processor
If you are using grep on the Zabbix server, the saved file might contain Windows-style newlines and you might get no output. In that case, convert the newlines by executing:
$ sed -i 's/
//' numeric.txt
Now that we have the numeric value for the first part, do the same for the second part of the performance counter:
$ grep -B 1 "^% Idle Time$" numeric.txt
1482
% Idle Time
We now have numeric values for all parts of the performance counter except the _Total. How can we translate that? We don't have to—this string is used as is on all locales. Our resulting performance counter would then look like this:
238(_Total)1482
As we already have an item gathering this information, we won't add another one. Instead, let's test it with the zabbix_get utility. On the Zabbix server, execute:
$ zabbix_get -s <Windows host IP> -k "perf_counter[238(_Total)1482]"
This should return the same data as the Processor(_Total)\% Idle Time key does:
99.577165
Another method to unify item keys that are using Zabbix configurations (so that a single template could be used for all hosts) is to specify performance counter aliases. To do that, add an Alias directive to the Zabbix agent configuration file. For example, if we wanted to refer to the performance counter we used, Processor(_Total)\% Idle Time, as cpu.idle_time, we would add the following:
Alias = cpu.idle_time:perf_counter[Processor(_Total)\% Idle Time]
On systems with a different locale the Alias entry would use a different performance counter, but from now on we can use the same item key for all systems: cpu.idle_time.
The Zabbix agent has another Windows-specific feature. It can gather performance counter values and return the average. This way, we can smooth out counters that return data for the last second and reduce the chance of missing abnormal data. For example, we could add a line like this in the agent demon configuration file:
PerfCounter = disk.writes,"PhysicalDisk(_Total)Disk Writes/sec",300
Based on this, the agent will collect the values from that performance counter every second and compute the average over five minutes. We could then query the agent once every five minutes and get an accurate idea of what the average writes per second were. If we didn't use the averaging, we would only get the data for the last second once every five minutes.