
Right, so we configured e-mail sending. But it's not so interesting until we actually receive some notifications. Let's increase the load on our test system. In the console, launch this:
$ cat /dev/urandom | md5sum
This grabs a pseudorandom, never-ending character stream and calculates its MD5 checksum, so system load should increase as a result. You can observe the outcome as a graph—navigate to Monitoring | Latest data and click on Graph for our single item again:
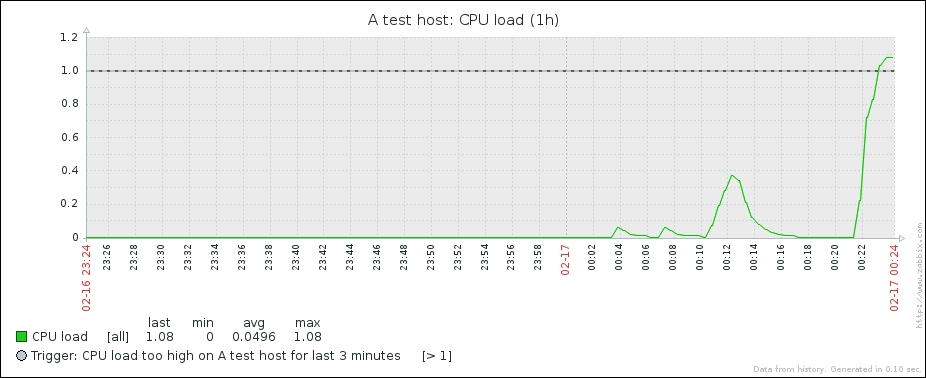
Notice how the system load has climbed. If your test system can cope with such a process really well, it might not be enough—in such a case, you can try running multiple such MD5 checksum calculation processes simultaneously.
Allow 3 minutes to pass and there should be a popup in the upper-right corner, accompanied by a sound alert:
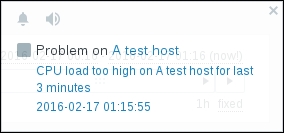
There is one of the frontend messages we enabled earlier in our user profile. Let's look at what is shown in the message window:
-
The small grey rectangle
 represents trigger severity. For recovery messages, it is green. We will discuss triggers in Chapter 6, Detecting Problems with Triggers.
- The first link leads to the Monitoring | Triggers page, displaying the current problems for the host that are causing the message.
- The second link leads to the Monitoring | Events page, displaying the problem history for the trigger in question. In this case, it is wrapped in two lines.
The third link leads to the event details, displaying more information about this particular occurrence.
The window itself can be repositioned vertically, but not horizontally—just drag it by the title bar. At the top of the window, there are three buttons:
These buttons also have tooltips to remind us what they do, which is as follows:
-
The snooze button
 silences the alarm sound that is currently being played.
-
The mute/unmute
 button allows to disable/enable all sounds.
-
The clear button
 clears the currently visible messages. A problem that is cleared this way will not show up later unless it is resolved and then happens again.
The frontend messaging is useful as it provides:
- Notifications of new and resolved problems when you aren't explicitly looking at a list of current issues
- Sound alarms
- Quick access to problem details
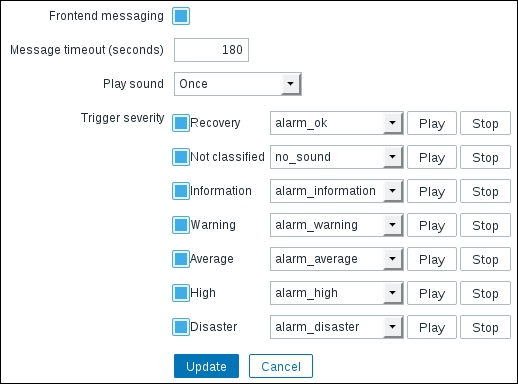
Now is a good time to revisit the configuration options of these frontend messages. Open the profile again by clicking on the link in the upper-right corner, and switch to the Messaging tab:
Here is what these parameters mean:
- Frontend messaging: This enables/disables messaging for the current user.
- Message timeout (seconds): This is used to specify how long a message should be shown. It affects the message itself, although it may affect the sound alarm as well.
- Play sound: This dropdown has the options Once, 10 seconds, and Message timeout. The first one will play the whole sound once. The second one will play the sound for 10 seconds, looping if necessary. The third will loop the sound for as long as the message is shown.
- Trigger severity: This lets you limit messages based on trigger severity (see Chapter 6, Detecting Problems with Triggers, for more information on triggers). Unmarking a checkbox will not notify you about that specific severity at all. If you want to get the message but not the sound alert, choose
no_soundfrom the dropdown.
Previously, when configuring frontend messaging, we set the message timeout to 180 seconds. The only reason was to give us enough time to explore the popup when it first appeared; it is not a requirement for using this feature.
Now, let's open Monitoring | Triggers. We should see the CPU load too high on A test host for last 3 minutes trigger visible with a red, flashing PROBLEM text in the STATUS column:

However, if you have a new e-mail notification, you should already be aware of this state change before opening Monitoring | Triggers. If all went as expected, you should have received an e-mail informing you about the problem, so check your e-mail client if you haven't yet. There should be a message with the subject PROBLEM: CPU load too high on A test host for last 3 minutes.
Did the e-mail fail to arrive? This is most often caused by some misconfiguration in the mail delivery chain preventing the message from passing. If possible, check your e-mail server's log files as well as network connectivity and spam filters. Going to Reports | Action log might reveal a helpful error message.
You can stop all MD5 checksum calculation processes now with a simple Ctrl + C. The trigger should then change status to OK, though you should allow at least the configured item interval of 30 seconds to pass.
Again, check your e-mail: there should be another message, this time informing you that it's alright now, having the subject OK: CPU load too high on A test host for last 3 minutes.
Congratulations, you have set up all required configuration to receive alerts whenever something goes wrong as well as when things go back to normal. Let's recall what we did and learned:
- We created a host. Hosts are monitored device representations in Zabbix that can have items attached.
- We also created an item, which is a basic way of obtaining information about a Zabbix system. Remember: the unique item identifier is key, which is also the string specifying what data will actually be gathered. A host was required to attach this item to.
- We explored a simple graph for the item that was immediately available without any configuration. The easy-to-use time-period selection controls allowed us to view any period and quickly zoom in for drilldown analysis.
- Having data already is an achievement in itself, but defining what a problem is frees us from manually trying to understand a huge number of values. That's where triggers come in. They contain expressions that define thresholds.
- Having a list of problems instead of raw data is a step forward, but it would still require someone looking at the list. We'd prefer being notified instead—that's what actions are for. We were able to specify who should be notified and when.