
The low-level discovery protocol provides an automated way to create items, triggers, and graphs for different entities on a computer. For instance, Zabbix can automatically start monitoring filesystems or network interfaces on your machine without the need to create items for each filesystem or network interface manually. Actually, the results found thanks to the discovery can trigger many different actions, such as even removing unneeded entities such as items and so on. This functionality gives a lot of flexibility to our monitoring system. Zabbix, indeed, lets you customize and create a brand-new low-level discovery rule to discovery any type of Zabbix entity.
Let's see which one is the output used by a low-level discovery item such as vfs.fs.discovery. To see the output, we can simply run the following command:
$ zabbix_get –s 127.0.0.1 –k vfs.fs.discovery
{"data":[
{"{#FSNAME}":"/","{#FSTYPE}":"rootfs"},
{"{#FSNAME}":"/proc","{#FSTYPE}":"proc"},
{"{#FSNAME}":"/sys","{#FSTYPE}":"sysfs"}
…
]}]
Here, we've reduced the output; anyway, as you can see, the output is easy to understand. First of all, this is a JSON-formatted output and is mostly in key-value format.
Then, as we saw in Chapter 7, Managing Templates, we can create all the scripts we need to properly automate the discovery of entities that need to be monitored.
Of course, every agent-side script must be registered as UserParameter of zabbix_agent.conf. Otherwise, if it is a server-side global script, it must be deployed in ExternalScriptspath that you've configured in zabbix_server.conf.
Let's see another example of a low-level discovery script that can be reused and will be useful to map all the open ports across your network. As we discussed in Chapter 7, Managing Templates, we need to have a JSON-formatted output with the port open and the relative protocol. To acquire this information, we can use nmap. To install nmap on Red Hat, you need to run the following command from root:
$ yum install nmap
This will install the only external component that we require. Now, to map all the open ports on a server, the best option is to run the script from the Zabbix server as it is possible that those ports are opened locally but hidden behind a firewall and are not accessible from our Zabbix server. Then, if we cannot reach them, we can't even monitor them. A command to run a quick port scan uses the –T<0-5> option, which sets the timing template (a higher number means a faster template). In this script, we are using the option –T4, followed by the –F (fast mode) option:
#!/bin/sh
#Start with JSON Header
echo '{'
echo ' "data":['
PORTS=( $(nmap -T4 -F ${1} | grep 'open' | cut -d" " -f1 ) )
COUNTER=${#PORTS[@]}
for PORT in "${PORTS[@]}"; do
        COUNTER=$(( COUNTER - 1))
        if [ $COUNTER -ne 0 ]; then
                echo '  { "{#PORT}":"'$(echo $PORT| cut -d/ -f1)}'", "{#PROTO}":"'$(echo $PORT| cut -d/ -f2)'" },'
        else
#it's the last element.
#To have valid JSON We don't add a trailing comma
                echo '  { "{#PORT}":"'$(echo $PORT| cut -d/ -f1)}'", "{#PROTO}":"'$(echo $PORT| cut -d/ -f2)'" }'
        fi
done
#End with JSON footer
echo ' ]'
echo '}'
The script running a port scan against the IP address specified will retrieve all the open ports that are not firewalled and the relative protocol. The output that the script produces is the following:
# ports_ldd.sh 192.168.1.1
{
 "data":[
  { "{#PORT}":"22}", "{#PROTO}":"tcp" },
  { "{#PORT}":"25}", "{#PROTO}":"tcp" },
  { "{#PORT}":"53}", "{#PROTO}":"tcp" },
  { "{#PORT}":"80}", "{#PROTO}":"tcp" },
  { "{#PORT}":"111}", "{#PROTO}":"tcp" },
  { "{#PORT}":"631}", "{#PROTO}":"tcp" },
  { "{#PORT}":"3306}", "{#PROTO}":"tcp" },
  { "{#PORT}":"5432}", "{#PROTO}":"tcp" }
 ]
}
This is the kind of output that we are expecting and, as you can see, is ready to be used. Of course, the script must be placed in your ExternalScripts location. Then, we can start creating the new Discovery rule tab, as shown in the following screenshot:
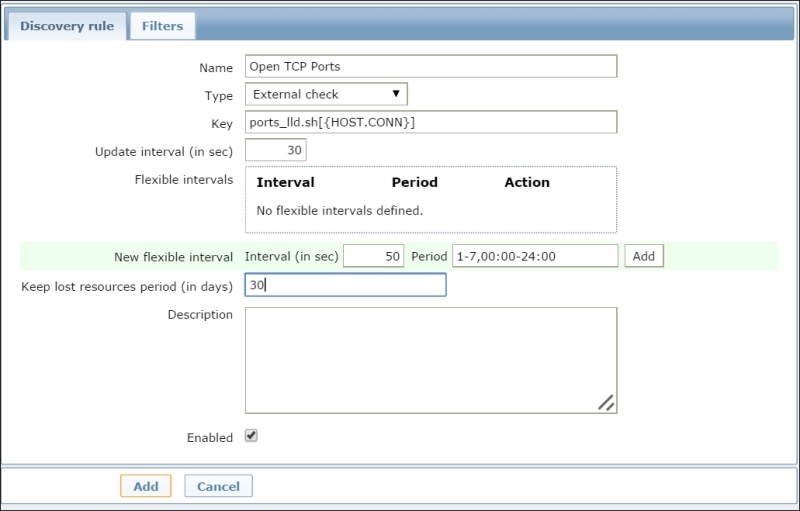
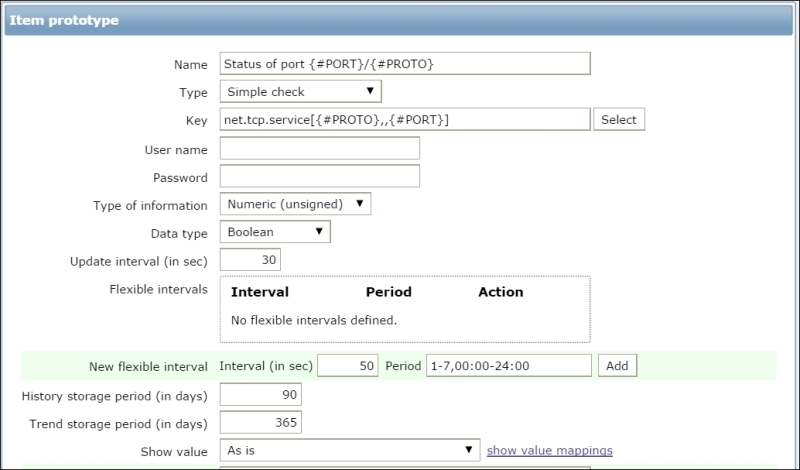
This will make the two variables {#PORT} and {#PROTO} ready to be used inside the prototypes. Let's create the Item prototype with the following properties:
- Name:
Status of port {#PORT}/{#PROTO} - Type: Simple check
- Key:
net.tcp.service[{#PROTO},,{#PORT}] - Type of information: Numeric (unsigned)
- Data type: Boolean
This is shown in the following screenshot:
Then, we need to create the relative trigger prototype with the following information:
- Name:
{#PROTO} port {#PORT} - Expression:
{Template_network:net.tcp.service[{#PROTO},,{#PORT}].last(0)}=0
With this kind of configuration, the discovery will do all the jobs for you, will find all the open ports that are reachable on a server, and will create the item and the relative trigger that will go on fire once the port is not accessible.
Note
Here, we are considering the case that you want to monitor all the services available on a server and then the trigger will send you an alarm if the port is not reachable. It is important to consider even the other case, where you're in a DMZ and you want to have a trigger if, for some reason, a service is reachable. One typical example is the database listener port, which should be accessible only within the DMZ and not from outside it.
This is just an example of automation, a simple one actually, but we can push the automation more. You can consider a network where you have a well-defined domain of services and you know the daemon in use or where at least the daemon banner is not changed to hide the service identity. In this case, a useful discovery customization would find all the open ports and, once the service behind them is identified, apply the relative template to the monitored server. For instance, we can think of port 80 as open, with an Apache service behind it, and then apply an Apache template ad hoc made to the host. This would definitely automate and reduce the initial startup cost and time.