
Having become familiar with simple, ad hoc, and custom graphs as well as network maps, we will explore a few more visualization options in this chapter. We will cover the following topics:
- Screens that can include other entities, including global and templated or host screens
- Slideshows that change displayed information on a periodic basis automatically
We looked at the individual visualization elements before; now is the time to move forward. Compound elements (which have nothing to do with map elements) allow us to combine individual elements and other sources to provide a more informative or good-looking overview. We might want to see a map of our network together with a graph of main outbound links, and perhaps also a list of current problems.
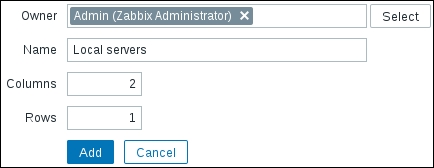
The graphs and maps we are familiar with cannot be combined in a single page on their own—for that, we may use an entity called a screen. Let's proceed with creating one together: navigate to Monitoring | Screens, and click on the Create screen button. Enter Local servers in the Name field and 2 in the Columns field. We will be able to add more later, if needed:
Click on Add, and then click on Constructor next to Local servers. We are presented with a fairly unimpressive view:
So it's up to us to spice it up. Click on the left-hand Change link, and we have an editing form replacing the previous cell contents. The default resource type is graph, and we created some graphs earlier: click on Select next to the Graph field. In the upcoming window, make sure A test host is selected in the Host dropdown, and then click on CPU load & traffic. That's all we want to configure here for now, so click on Add.
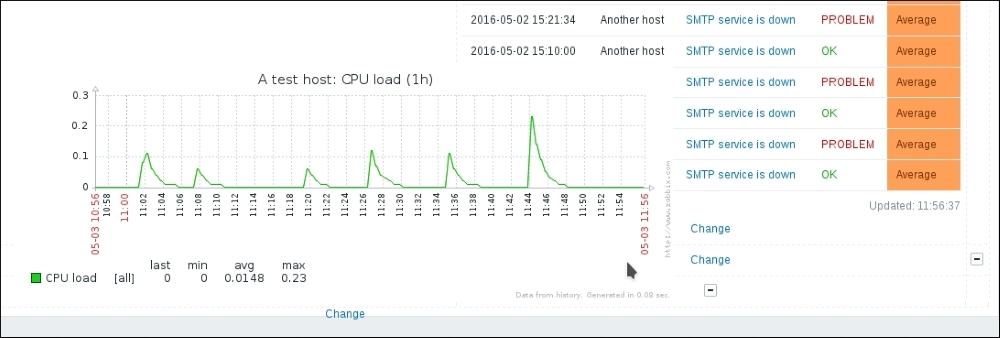
Now, click on the right-hand Change link and then on Select next to the Graph field. In the upcoming window, click on Used diskspace (pie). Remember how we tuned the pie-chart dimensions before? When inserting elements for screens, we override their configured dimensions. This time, our pie chart has to share space with the other graph, so enter 390 in the Width field and 290 in the Height field, and then click on Add. While we can immediately see the result of our work here, let's look at it in all its glory—go to Monitoring | Screens and click on Local servers in the NAME column:
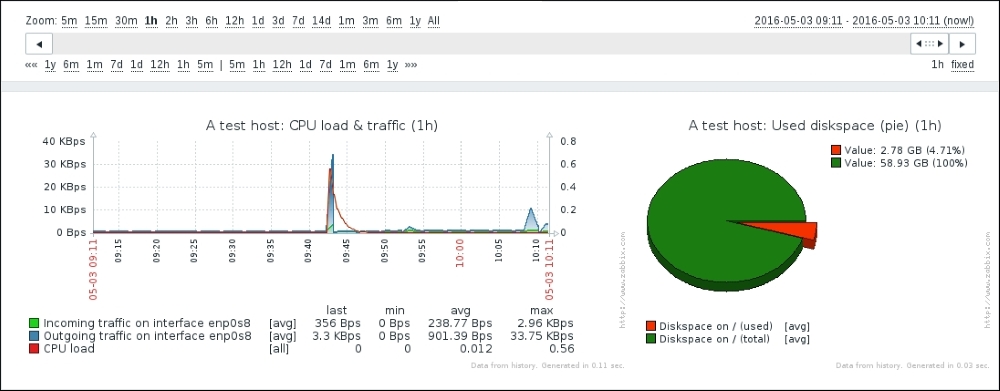
We now have both graphs displayed on a single page. But hey, take a look above the screen: the controls there look very much like the ones we used for graphs. And they are: using these controls, it is possible to do the same things as with graphs, only for all the screen elements. We can make all screen elements display data for a longer period of time or see what the situation was at some point in the past.
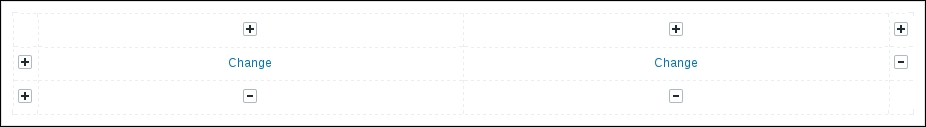
Two graphs are nice, but earlier, we talked about having a map and a graph on the same page. Let's see how we can make that happen. Click on All screens above the currently displayed screen, and click on Constructor next to Local servers. We want to add our map at the top of this screen, but we can see here that we created our screen with two columns and single row, so we have to add more. Couldn't we do that in the general screen properties, using the same fields we used when we created the screen? Of course we could, but with one limitation: increasing the column and row count there will only add new columns and rows to the right or at the bottom, respectively. There is no way to insert rows and columns at arbitrary positions using that form. That's why we will use a different approach.
Look at those + and – buttons around the screen. They allow you to insert or remove columns and rows at arbitrary positions. While the layout might seem confusing at first, understanding a few basic principles should allow you to use them efficiently:
- Buttons at the top and bottom operate on columns
- Buttons on the left and right operate on rows
- + buttons add a column or row before the column or row they are positioned at
- - buttons remove the column or the row where they are positioned
In this case, we want to add another row at the top, so click on the upper-left + icon in the first column—the column that has + and – controls only, not the one that has a graph already. This adds a row above our graphs with two columns, both having a Change link, just like before. Click on the first Change link. It's not a graph we want to add, so choose Map from the Resource dropdown. Click on Select next to the Map field, and then click on First map. If we leave other parameters as they are, the map will appear on top of the left-hand column. Having it centered above both columns would look better. That's what the Column span option is: enter 2 in that field, and then click on Add. As can be immediately seen, this screen element now spans two columns. This capability is not limited to maps; any element can span multiple columns or rows.
We now have a screen containing a network map and two graphs, showing data about A test host. Now, we should create a screen showing data for Another host. We'll probably have to repeat all the steps we performed for this one as well. That would be quite bad, especially for many hosts, wouldn't it? That's why there is a different, much easier approach.
Click on the Change link below the CPU load & traffic graph in the screen configuration, and look at the last parameter in there:
Let's find out what a dynamic item means—mark this option and click on Update. While that seemingly did nothing, edit the other graph, mark the Dynamic item checkbox, and click on Update. It's now time to check out the result—go to Monitoring | Screens, and click on Local servers in the NAME column. Look at the available dropdowns at the top of the screen:

As soon as we marked some elements as dynamic, we got given the choice of other hosts. Let's check out how well this works. Select Linux servers from the Group dropdown and Another host from the Host dropdown:
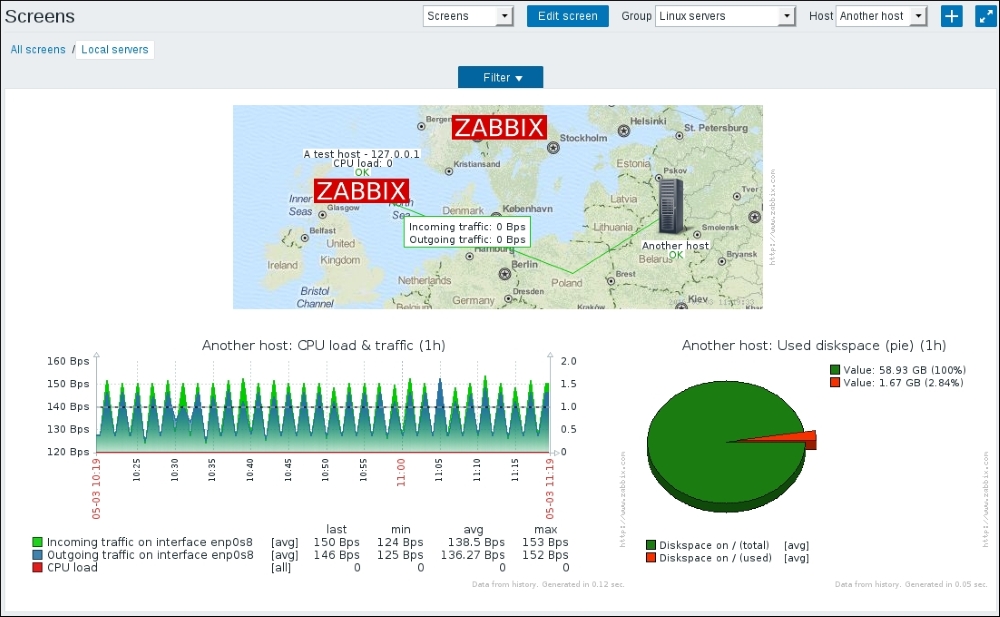
Wonderful! Elements marked as dynamic now show data from the selected host, while non-dynamic elements show the same data no matter which host is selected. The static elements could be maps like in our screen, but they could also be graphs if the Dynamic item option hasn't been checked for them. That would allow us to switch a screen to show server information in some graphs, but other graphs could keep on showing general network information.
Tip
Only graphs from hosts can be added to screens; graphs from templates cannot. For a dynamic screen item, there is a risk that the host from which the graph was initially selected gets deleted, thus breaking the screen. Old versions of Zabbix allowed us to include graphs from templates here, and that functionality might return later.
This is a nice, simple screen, but there were many more available screen elements to choose from, so let's create another screen. Go to the list of screens—if a screen is shown in the monitoring view, click on All screens, and then click on the Create screen button. In the resulting form, enter "Experimental screen" in the Name field, enter 2 for both the Columns and Rows fields, and then click on Add. In the screen list, click on Constructor next to Experimental screen. As before, click on the Change link in the upper-left cell. In the Resource dropdown, choose Simple graph, and then click on Select next to the Item field. Select A test host from the Host dropdown.
As we can see, all the simple graphs that are available without any manual configuration can also be added to a screen. Here, click on the CPU load entry. In the Width field, enter 600, and then click on Add. Click on the Change link in the upper-right cell. Choose History of events from the Resource dropdown, and then click on Add.
Well, suddenly our graph doesn't look that great any more—it should be taller to fit this layout. We could place it below the events list, but that would require deleting it and reconfiguring the lower-right cell. Well, not quite. Drag the graph to the lower-right cell and release the mouse button:
The element (in this case, a graph) is moved from one cell to another, requiring no reconfiguration of individual cells.
The upper-left cell is now empty, so click on Change there. Select Triggers info from the Resource dropdown, select Vertical in the Style option, and then click on Add. This screen element provides us with high-level information on trigger distribution by severity. Let's populate this screen even more now. Click on the Change link in the lower-left corner. In the screen element configuration, select Triggers overview from the Resource dropdown, and start typing linux in the Group field. Click on Linux servers from the dropdown. We have more triggers than hosts in this group—select Top for the Hosts location option, and click on Add. The elements are misaligned again, right?
We'll try out some alignment work now. Click on the second + button from the top in the first column (next to the overview element we just added). This inserts a row before the second row. Drag the Triggers overview element (the one we added last) up one row, to the first cell in the row we just added. Click on the Change link for the History of events element (upper-right cell), enter 20 in the Show lines field and 2 in the Row span field, and click on Update.
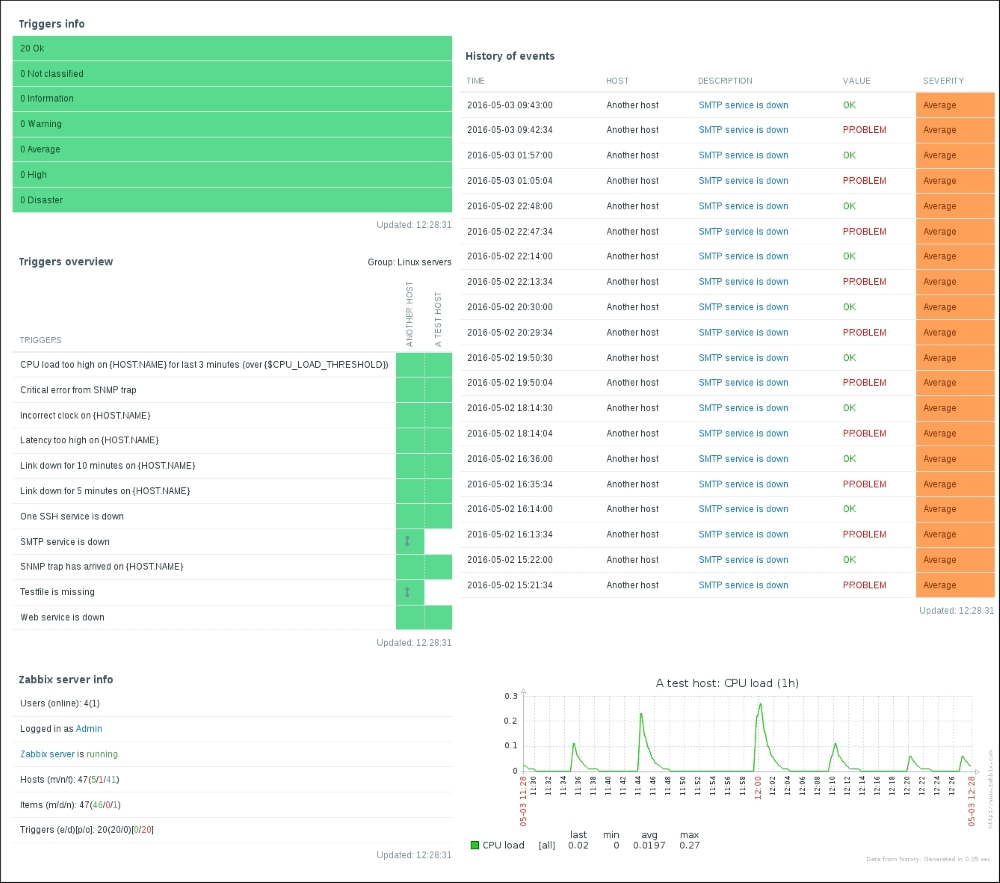
Our screen now looks quite nice, except that the lower-left corner is empty. Click on Change in that cell, select Server info from the Resource dropdown, and then click on Add. The screen looks fairly well laid out now. Let's look at it in the monitoring view by going to Monitoring | Screens and clicking on Experimental screen in the NAME column:
It was mentioned earlier that all graphs show the same time period in a screen. That is true if the graphs are added as normal screen elements. It is possible to add graphs that show a static period of time using the URL screen element, which allows including any page in a screen. In that case, the URL should point back to the Zabbix frontend instance. For example, showing a simple graph could be achieved using a URL such as this: http://zabbix.frontend/zabbix/chart.php?period=3600&itemids[0]=23704&width=600. You can find out the item ID by opening the simple graph of that item and looking at the URL. Note that the width of the graph image should be manually adjusted to match the screen cell width and avoid scrollbars in the screen cell. This way, we could configure a screen that shows hourly, daily, weekly, monthly, and yearly graphs of the same item.
As we discovered, screens in Zabbix allow very flexible visual layouts. You can choose to have a map, followed by more detailed graphs. Or you can have graphs of the most important information for a group of servers, and a trigger summary at the top. Or any other combination—there are many more possible screen elements to be added. It might be a good idea to try out all of the available screen elements and see what information they provide.
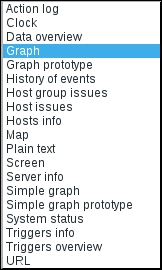
The screens we have configured so far are global screens—they can contain lots of different elements, are available in the Monitoring | Screens section, and, if some elements are set to be dynamic, we can choose any other host in the dropdown to see its data. Zabbix also offers another way to configure and use screens: templated screens, also known as host screens. These are configured on a template and are then available for all the hosts that are linked to that template. Let's create a simple screen: navigate to Configuration | Templates and click on Screens next to C_Template_Linux. Then, click on the Create screen button. In the Name field, enter Templated screen and click on Add. The same as with global screens, click on Constructor in the ACTIONS column. So far, the configuration has been pretty much the same. Now, click on the Change link in the only cell, and expand the Resource dropdown. The list of available resources is much smaller than it was in the global screens. Let's compare those lists:
|
Global screen resources |
Templated screen resources |
|---|---|
|
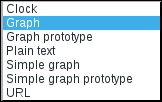
|
As can be seen, global screens offer 19 different types of elements, while templated screens offer only seven.
For our screen right now, leave the Resource dropdown at Graph and click on Select next to the Graph field. Notice how the current template is selected and cannot be changed—all elements added to a templated screen must come from the same template. In the popup, click on CPU load & traffic in the NAME column, and then click on Add. Click on the + icon in the upper-right corner to add another column, and click on the Change link in the rightmost cell. In the Resource dropdown, choose Simple graph, click on Select next to the Item field, and then click on CPU load in the NAME column. Click on the Add button. Now, navigate to Configuration | Hosts and take a look at the available columns for each host. There is no column for screens. Templated or host screens are only configured on the template level; they do not get a copy on the host like items, triggers, and other entities do.
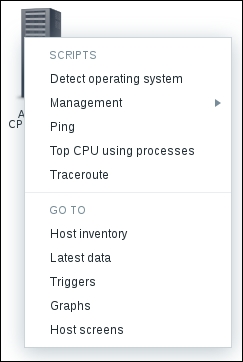
Let's go to Monitoring | Screens. If we look at the screen list there, the screen we just configured cannot be found. Templated or host screens can only be accessed from the host pop-up menu in the following locations:
- Monitoring | Dashboard (in the Last 20 issues widget)
- Monitoring | Overview (if hosts are located on the left-hand side)
- Monitoring | Latest data (if filtering by the Host field isn't done)
- Monitoring | Triggers
- Monitoring | Events
- Monitoring | Maps
They are also available from these two pages:
- Global search results
- The host inventory page
Let's move on to Monitoring | Maps: click on Host group elements in the NAME column. In the map, click on either A test host or Another host. This time, the Host screens entry in the menu is enabled—click on that one:
The screen we configured earlier opens, showing the data from this specific host:
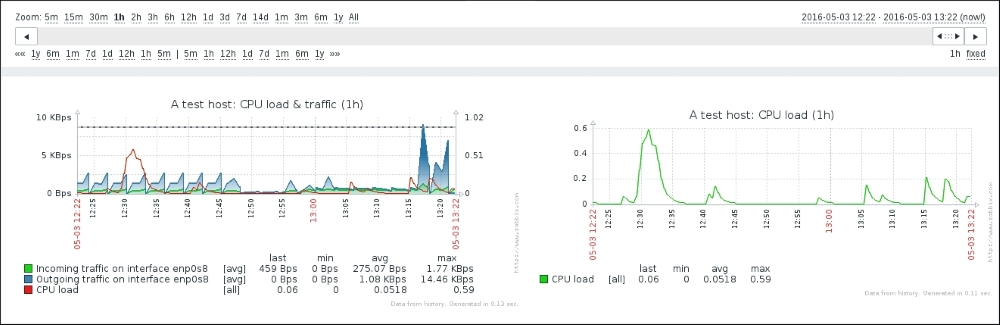
If we had multiple screens configured in this template, they would be available in the dropdown in the upper-right corner. Remember that these screens will only be available for hosts that are linked to this template.
One thing to notice on this screen is the difference in height for both graphs. When configuring the screen, we did not change the height value, and it was the same for both graphs, 100. Unfortunately, that's not the height of the whole graph, but only of the graph wall area. As a result, if having different item counts, a trigger or a percentile line will result in a different graph height. For a screen, this means a quite tedious configuration to get the dimensions to match. The same also applies to width—there, having one or two Y-axis values will result in a different graph width.
Should one use a templated or global screen? Several factors will affect that decision:
- The availability of the elements (global screens have many more)
- Navigation (Monitoring | Screens versus the popup menus)
- Which and how many hosts need such a screen