
Now that you have a Zabbix installation that is properly sized for your environment, you will want to actually start monitoring it. While it's quite easy to identify which hosts and appliances, physical or otherwise, you may want to monitor, it may not be immediately clear what actual measurements you should take on them. The metrics that you can define on a host are called items, and this chapter will discuss their key features and characteristics. The first part will be more theoretical and will focus on the following:
- Items as metrics, not for status checks
- Data flow and directionality for items
- Trapper items as a means to control the data flow
We will then move to a more practical and specific approach and will discuss how to configure items to gather data from the following data sources:
- Databases and ODBC sources
- Java applications, the JMX console, and SNMP agents
- SSH monitoring
- IMPI items
- Web page monitoring
- Aggregated and calculated items
One of the most important features that sets Zabbix apart from most other monitoring solutions is that its main mode of interaction with the monitored objects is focused on gathering raw data as opposed to alerts or status updates. In other words, many monitoring applications have the workflow (or variation) as shown in the following diagram:
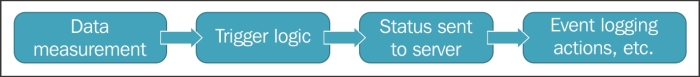
That is, an agent or any other monitoring probe is asked to not only take a measurement, but also incorporate a kind of status decision about the said measurement before sending it to the main server's component for further processing.
On the other hand, the basic Zabbix workflow is subtly, but crucially, different, as shown in the following diagram:
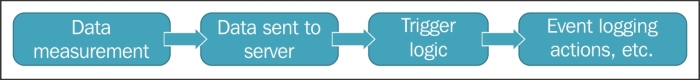
Here, an agent or monitoring probe is tasked with just the measurement part, and then it sends the said measurement to the server component for storage and eventually for further processing.
The data is not associated with a specific trigger decision (pass/fail, ok/warning/error, or any other variation) but is kept on the server as a single data point or measurement. Where applicable, that is, for numeric types, it's also kept in an aggregate and trending format as minimum, maximum, and average, over different periods of time. Keeping data separated from the decision logic, but all in a single place, gives Zabbix two distinct advantages.
The first one is that you can use Zabbix to gather data on things that are not directly related to the possible alerts and actions that you have to take, but related to the overall performance and behavior of a system. A classic example is that of a switch with many ports. You may not be interested in being alerted about anomalous traffic on every single port (as it may also be difficult to exactly define anomalous traffic on a single port with no contextual information), but you may be interested in gathering both port-level and switch-level traffic measurement in order to establish a baseline, evaluate possible bottlenecks, or plan for an expansion of your network infrastructure. Similar cases can be made about the CPU and core usage, storage capacity, number of concurrent users on a given application, and much more. At its simplest, Zabbix could even be used to gather the usage data and visualize it in different graphs and plots, without even touching its powerful trigger and correlation features, and still prove to be an excellent investment of your time and resources.
Speaking of triggering, the second big advantage of having a full, central database of raw data as opposed to a single measurement (or at best, just a handful of measurements of the same item) is that, for every trigger and decision logic need that you may have, you can leverage the whole measurement database to exactly define the kind of event that you want to monitor and be alerted about. You don't need to rely on a single measurement; you don't even need to rely on the latest measurement, plus a few of the previous ones of the same item or limit yourself to items from the same host. In fact, you can correlate anything with anything else in your item history database. This is a feature that is so powerful that we have dedicated an entire chapter to it, and you can go directly to the next one if that's what you want to read about. It would suffice to say that all this power is based on the fact that Zabbix completely separates its data-gathering functions from its trigger logic and action functions. All of this is based on the fact that measurements are just measurements and nothing else.
So, in Zabbix, an item represents a single metric—a single source of data and measurements. There are many kinds of native Zabbix items even without considering the custom ones that you can define using external scripts. In this chapter, you will learn about some of the less obvious but very interesting ones. You will see how to deal with databases, how to integrate something as alien as SNMP traps to the Zabbix mindset, how to aggregate the existing items together to represent and monitor clusters, and more. As you lay a solid foundation, with sensible and strategic item definition and data gathering, you will be able to confidently rely on it to develop your event management and data visualization functions, as you will see in the following chapters.