
It's now time to start exploring the web interface. The web interface is not very straightforward, and you may find it difficult to get around. In this recipe, we will guide you through the Zabbix frontend, so that you can easily find your way in the Zabbix web interface.
In this recipe, we start with the standard Zabbix configuration. So you need a basic CentOS or RHEL setup or another Linux OS with Zabbix properly set up. If you haven't set up Zabbix yet, you have to do this first. Select your Zabbix version currently still version 2.4. For installation instructions go to Zabbix Manual | 3 Installation.
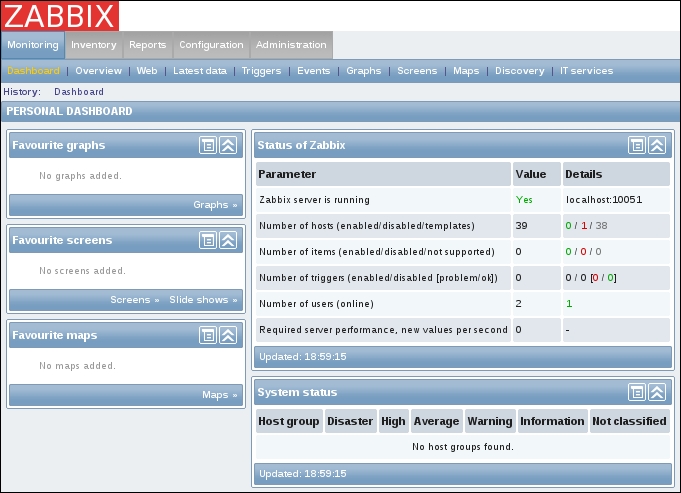
As you can see in the following image, the first page that we get when we log in is the main page, with an overview of the information received from Zabbix. This is your personal dashboard that can be customized to your own needs and preferences. All boxes on this screen that you see, such as Status of Zabbix, System status, and so on. are drag-and-drop based. On top, you will see two menu bars. First menu bar starts with Monitoring and the bar below starts with Dashboard. Move your mouse to Configuration without clicking, then select hosts from the menu bar below Configuration. As you may have noticed, we can move around in the Zabbix menu without clicking on the menu bar. We only have to click on hosts if we want to go to hosts in the menu.
The first menu bar is the main bar where we split up things in Zabbix such as Configuration, Inventory, Reports, and so on. As we will see later, depending on what permissions you have, you will see more or less from this menu bar. The second bar will show you the options for each item you have selected in the first menu section.
Just below the bar that starts with Dashboard, you will see History. History will show you the history of places you have been in the Zabbix frontend. This makes it easier to go back to a page you have been before.
At the bottom of the web page, you will see the version of the Zabbix frontend. In this case you will see Zabbix 2.4.x on the bottom of the screenshot:
The first menu that we will discuss is the upper right menu. This menu has some handy features for the system and some user-only settings:
- The first option Help brings us to the Zabbix documentation page. This is an easy shortcut if you need some help with the configuration of Zabbix.
- The Get support link will redirect you to the Zabbix page where all different options of technical support are explained. Remember that Zabbix is a 100 percent free product. So one of the ways Zabbix can make money and develop our nice free monitoring solution is by selling support.
- Print will make your life easier when you want to print the Zabbix page on paper. It will take away the menu from the top, so that only relevant information on the web page is left to print.
- The next option Profile is unique for each user.
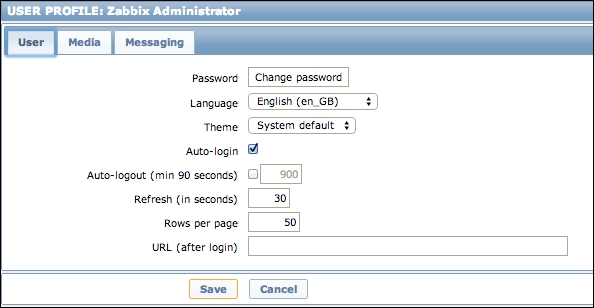
- In the first tab User, we can alter our password, interface language, and the preferred theme that we want to use. If some language is missing, it is possible that you need to install the locales on your server. There is also an option to Auto-login without username or password. An Auto-logout function that will make sure no one enters the system when you forget to logout or lock your computer. The Refresh option let's you set the number of seconds after which the information on the page is refreshed. The Rows per page option will let you decide how many rows are shown but remember less rows means faster loading. URL (after login) is the web page you will see after the login.
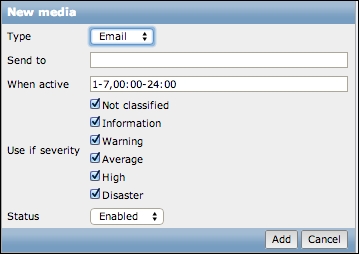
- The Media tab is the place where the user can add the media that he or she wants to use to get notifications. Zabbix allows at this time, the use of Email, Jabber, and/or SMS. The user can decide here which media is active for hours and days. Also, the severity level for getting notifications can be chosen here:
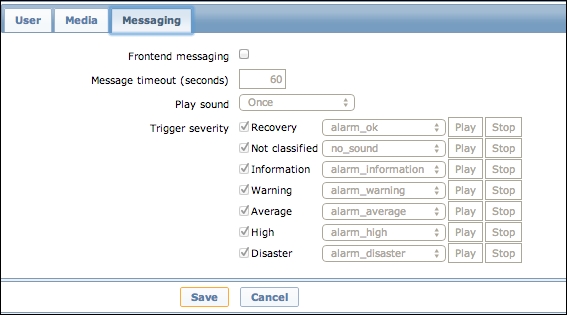
- Next and last tab is the Messaging tab. Here each individual user can set his or her own notifications for the desktop. This means that each user can be notified by a popup on the desktop with a sound. Select Frontend messaging to get notified. Select the timeout period (how long the message stays on the screen) and select if you would like to get notified once every 10 seconds or if you would like to keep sound repeated while the message is on screen. Next thing to do is select for each Trigger severity if we want to be notified and what sound we want to hear.
- In the first tab User, we can alter our password, interface language, and the preferred theme that we want to use. If some language is missing, it is possible that you need to install the locales on your server. There is also an option to Auto-login without username or password. An Auto-logout function that will make sure no one enters the system when you forget to logout or lock your computer. The Refresh option let's you set the number of seconds after which the information on the page is refreshed. The Rows per page option will let you decide how many rows are shown but remember less rows means faster loading. URL (after login) is the web page you will see after the login.
- Back to our previous menu, we have the logout option left. This one explains itself; we use it to log out after a hard day at work. More information can be found in the Zabbix documentation under Web interface | User profile or for Zabbix 2.4 follow next URL: https://www.zabbix.com/documentation/2.4/manual/web_interface/user_profile. Back to our front page, we have our next important menu in Zabbix. This menu is probably the menu you will use the most be it as normal user or as admin user. We will explain you what each button in the menu bar does, so that you get a good understanding of the items in the Zabbix menu:

- The first row shows us the option Monitoring. When we put our mouse over Monitoring, the bar below will adapt and show everything that we need to get our data that was gathered by Zabbix visualized. This can be raw data that we see or a graph, map, slideshow, and so on.
- The next button named Inventory will bring us to the inventory system of Zabbix. Zabbix can make an inventory of a park that we monitor and when we go to inventory, we will get an overview of each host inventory data by parameter or the complete host inventory details.
- When going to Reports we will get an overview of some standard predefined and user customizable reports. Reports will show us the the Status of Zabbix, Availability report, Triggers top 100, and Bar report.
- The next item is Configuration. The Configuration menu contains a list of options to choose from, all with focus on configuring Zabbix. It contains configuration settings such as hosts, host groups, templates, actions, maps, and so on. This menu option is the most important when configuring Zabbix. Only administrators and super administrators will be able to see this option.
- And the last menu Administration is for the administrative functions of Zabbix such as the creation of users, media types, authentication, and so on. In Zabbix, we logged in as the admin user. This user is a super administrator and only super administrators will be able to see this option.
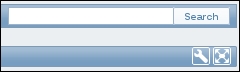
- On the top right of our web page, we have a global Search box in Zabbix. This box allows us to do a search for host, host groups and templates in Zabbix and the entities that belong to them.
- Just below the Search box we have another button that looks like a working tool. This acts as a configurable filter. Click on it and you will see that you have the possibility to enable the dashboard filter and adjust some settings like only show certain host groups or only certain levels of severity and even only unacknowledged problems.
- The next button that looks like a square with 4 arrows in it is to put our Zabbix page in full screen mode. This can be handy for people working in a service center or just to avoid getting distracted with all menu options:
Tip
Zabbix will give users access to parts of the menu based on the user role. Besides super administrators there are also administrators in Zabbix. Administrators will see everything except the Administration menu. Normal users will see everything except Configuration and Administration in the menu.
- Next on our front page, are some columns with all kind of statuses from Zabbix such as the Status of Zabbix, System status, and also some columns with favorites. Let me go a little deeper into what their use is and why you should care about them.
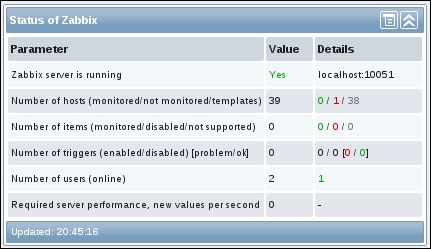
- Probably one of the more important tables is the Status of Zabbix table. The first line will show us if the Zabbix server is running. Remember that the frontend is a different package, so the fact that we can login to the web interface does not mean that our Zabbix server is running. Here we can see with a Yes or a No if the server is running and if the Zabbix server runs local or on another server. Next line will show us the Number of hosts that are configured and behind it the number of hosts being monitored, not monitored and the number of templates.
- Next line will show us the Number of items that are linked to hosts that are enabled in Zabbix. Behind this column we see the number of items that are active being monitored, those that are disabled and at last, the ones that are not supported. Be careful with unsupported items, as Zabbix will check them from time to time to see if data can be gathered from them so they will eat up your resources.
- Next, we see Number of triggers. First number will show us the total number of triggers linked to enabled hosts. In the next column, we see the number of enabled and disabled triggers and then two numbers between square brackets. First number will show us the number of triggers in problem state and then those in ok state.
- The next line tells us the Number of users configured in Zabbix. Beware, only the last column will show us the value of users online in Zabbix. Zabbix comes standard with guest user activated so this is the second user.
- The last line will show us the Required server performance. This number will tell us how many new values per second Zabbix expects. This number is an indication of how many values per second will go into our database and can be a good indication to see what kind of hardware we need. You could compare it with others on the internet.
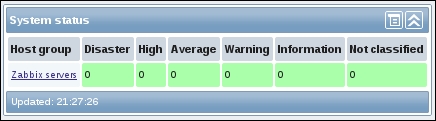
- Our next dashboard widget is the System status widget. In this place we get an overview of all host groups and the status of the servers in the group. If one of the servers in one of the groups gets a problem, the color will change from green to something else. When we hover with the mouse over the box with a new color, a message is shown and tells us which server has a problem:
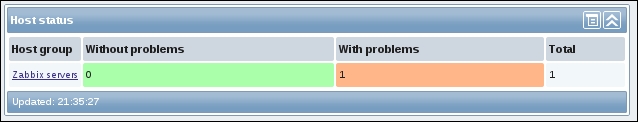
- Just below system status, we have the Host status widget. Here we get an overview of our hosts with a quick indication of how many problems there are on our host. When we hover over without the mouse, we will see how many of our problems are critical, average, and so on:
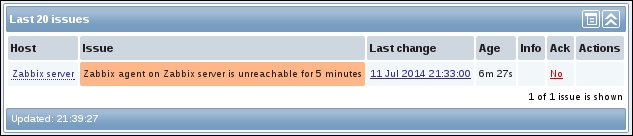
- The Last 20 issues widget is an overview of the last 20 issues that have been detected by Zabbix. It will show you the time the last status change happened and also how many minutes ago this was, so you have the opportunity to acknowledge the problem. When you acknowledge a problem, you get a box where you can write what you have done to solve the issue or some other information:
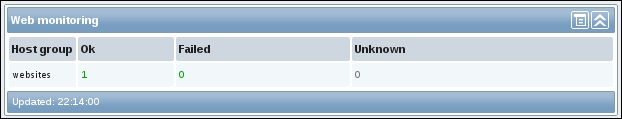
- The last box at the bottom of our page is the Web monitoring widget. It is possible to monitor web pages with Zabbix. This widget will show us an overview of the websites we monitor per group and how many are in status Ok or Failed.
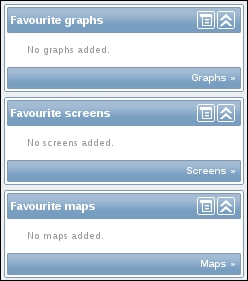
- On our left side of the web page are some small boxes with favorites for graphs, screens and maps. As the name suggests, here each user can add his favorite links to graphs, screens, and maps in Zabbix:
- As you may already have noticed, there are two buttons on every widget in the top right corner. The first context menu will allow us to change the refresh list in case of the monitoring applets in the middle of our screen. On the left side with the favorite widgets, it will allow us to quickly add some favorites.
The second context button will make it possible to close our widget in case we are not interested in the information from it.

We have seen that the Zabbix dashboard can be built dynamically. We can move widgets around so that we do not have to scroll around in our screen to find the information we need. The first menu bar on top where we can choose from monitoring, inventory, reports, configuration, and administration is the most important menu. For each category we hover over, it will show the options available in the menu bar below it. Also depending on what rights the user has, this menu bar will show more or less.
- In the Creating users recipe in Chapter 3, we will explain how to create users with the correct rights.