
While automatic discovery and monitoring works great, it is useful to understand how exactly it works, both to be able to extend it and to solve problems as they arise. We'll look at two areas in more detail:
- LLD configuration in the default templates and host prototypes
- Server operation and configuration details
Let's dissect the default templates and how they operate. We only linked a single template, and it ended up discovering all hypervisors and virtual machines—it's time to find out how that happened. The top-level template, Template Virt VMware, also does some direct monitoring, although not much—it has items for VMware Event log, Full name, and Version:
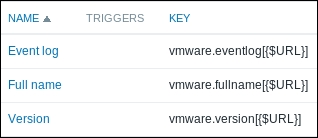
These would be collected on the vCenter or vSphere level. It all grows more interesting and complicated when we look at the LLD rules on this template. It discovers VMware clusters, hypervisors, and individual virtual machines. Admittedly, cluster discovery isn't that complicated—it only has a single item prototype to monitor cluster status. Hypervisor discovery uses an LLD feature we haven't looked at yet—host prototypes.
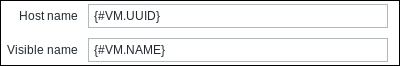
If we go to Configuration | Templates and click on Discovery next to Template Virt VMware, we'll see that there is a single host prototype in the Discover VMware hypervisors LLD rule. Click on Host prototypes, and then click on {#HV.NAME} in the NAME column:

Here, LLD macros are used again. We looked at their use in item and trigger prototypes, but here, they are used for the Host name and Visible name in the host prototype. The interesting part is the usage of different macros in these fields. Host name, the one used to identify the host, is not the hypervisor name, but its UUID. The human-friendly name goes in the Visible name field. When a hypervisor is referenced, it must be done by the UUID, and it will also be referenced by that UUID in the server log messages.
The Templates tab does not hold many surprises—it instructs Zabbix to link any discovered hypervisors to Template Virt VMware Hypervisor. Let's switch to the Groups tab now:
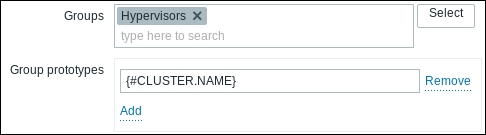
This is a bit more interesting. Host prototypes can instruct created hosts to be placed in existing host groups, listed in the Groups field. Additionally, they can instruct new groups to be created based on Group prototypes and created hosts to be included in those groups. Group prototypes are similar to other prototypes—the resulting names must be unique, and that means we should use some LLD macro in the group name.
The Discover VMware VMs LLD rule in this template is similar: it holds a single host prototype to be used for all discovered virtual machines. Just as with hypervisors, the UUID is used for the hostname, and that would also be the one appearing in the server log file:
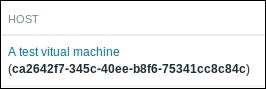
In the frontend, we may search both by the Host name and Visible name. If searching by the hostname—and this might be common as we will see it in log files—the visible name will be shown as usual, with the hostname displayed below it and made bold to indicate that it matched the search:
In the Templates tab, we can see that the created hosts will be linked to Template Virt VMware Guest. It's worth looking at the Groups tab for this host prototype. Besides adding all discovered virtual machines to an existing group, Virtual machines, two group prototypes are used here:
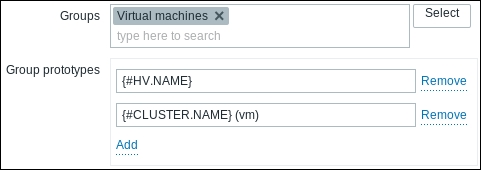
As seen in the host-group page earlier, a group would be created per hypervisor and per cluster, holding all virtual machines on that hypervisor or in that cluster.
We have looked at what the default set of VMware templates does, but it can be a bit confusing to understand how they interact and what configuration entity creates what. Let's try to summarize their interaction and purpose in a schematic. Here, hosts that receive the listed template are represented with a thick border, while various LLD rules with a thin border:
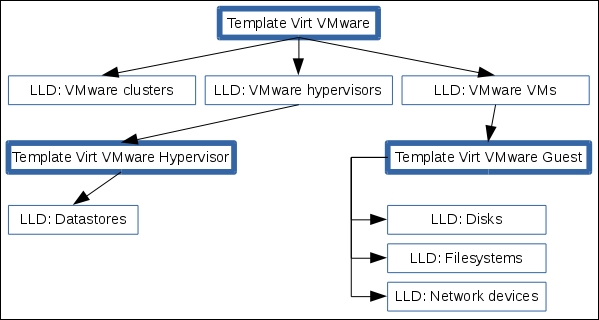
If a template has host prototypes, thus resulting in more hosts being created, it points to another thick-bordered host box, which in turn is linked to another template.
But remember that for this tree to start working, we only had to create a single host and link it to a single template, Template Virt VMware.
We know how Zabbix deals with information once that information has been received, but there is a whole process to get it. That process is interesting on its own, but there are also parameters to tune in addition to StartVMwareCollectors, which we discussed earlier. First, let's examine how the values end up in items. The following schematic shows data flow starting with VMware and ending with the Zabbix history cache:
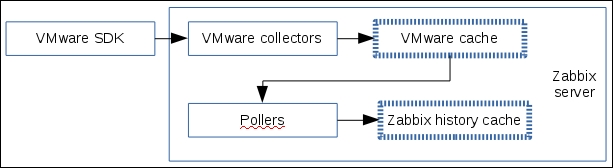
Here, the steps happening inside the Zabbix server are grouped, and arrows indicate the data flow direction—connections are actually made from the VMware collectors to the VMware SDK interface. The collectors start by grabbing data and placing it in a special cache—caches are indicated with a dashed border here. Then pollers, the same processes that are responsible for passive Zabbix agents, SNMP, and other item types, grab some values from that cache and place them in the Zabbix history cache. For now, ignore the details in the history cache—we will discuss that more in Chapter 22, Zabbix Maintenance.
Note
Why the intermediate VMware cache?
When VMware items are added, there are quite a lot of them, with various intervals. If Zabbix were to make a connection to VMware for every value, it would be a performance disaster. Instead, VMware collectors grab everything from the VMware SDK interface, place that in the cache, and then the pollers pick the required values from that cache. This way, a lot of items can get their values grabbed from the VMware cache instead of having to bother VMware every single time.
Now is a good time to look at the VMware-related configuration parameters in the server configuration file. We already covered StartVMwareCollectors, the processes that connected to the VMware interface and placed information in a special VMware cache. This cache by default is set to 8 MB, and this size can be controlled with the VMwareCacheSize parameter. How would one know when that should be changed? The best way is to monitor the usage and adjust accordingly. We will discuss the monitoring of internal caches in Chapter 22, Zabbix Maintenance.
Sometimes, connections to the VMware interface could get stuck. It could either be a single slow instance that slows down the monitoring of other instances, or it could be a single request going bad. In any case, connections to VMware instances will time out after 10 seconds by default. This time can be controlled with the VMwareTimeout parameter.
We just have two VMware-specific parameters left: VMwareFrequency and VMwarePerfFrequency. Zabbix queries some of the information using the VMware internal performance counters. At the time of writing this, the following item keys on the hypervisor level are extracted from the performance counters:
vmware.hv.network.invmware.hv.network.outvmware.hv.datastore.readvmware.hv.datastore.writevmware.hv.perfcounter
On the virtual machine level, the following keys are extracted from the performance counters:
vmware.vm.cpu.readyvmware.vm.net.if.invmware.vm.net.if.outvmware.vm.perfcountervmware.vm.vfs.dev.readvmware.vm.vfs.dev.write
What does this actually mean? The item keys, listed previously, get new information as often as VMwarePerfFrequency is set to. To put it differently, it does not make sense to set the frequency of any items listed here lower than VMwarePerfFrequency. All other items, including low-level discoveries, get their information as often as VMwareFrequency is set to, and it does not make sense to set the frequency of other items and LLD rules lower than VMwareFrequency.
We could also say that both of these parameters should be set to match the lowest frequency for their corresponding items, but we have to be careful—setting these too low could overload VMware instances. By default, both of these parameters are set to 60 seconds. This is fine for small and average environments, but on a large VMware instance, we might want to increase them both, while potentially increasing VMwareTimeout as well.