
We created some hosts and host groups earlier, thus exploring the way items can be grouped and attached to hosts. Now is the time to take a closer look at these concepts and see what benefits they provide. We will:
- Explore host inventory and ways to automatically populate it
- Take a look at host and host group maintenance, which enables us to stop collecting data or suppress alerts
- Find out about the permission system in Zabbix so that you are able to allow partial access to other users as necessary
A host can be considered as a basic grouping unit in Zabbix configuration. As you might remember, hosts are used to group items, which in turn are basic data-acquiring structures. Each host can have any number of items assigned, spanning all item types: Zabbix agents, simple checks, SNMP, IPMI, and so on. An item can't exist on its own, so hosts are mandatory.
Zabbix does not allow a host to be left alone, that is, not belong to any group. Let's look at what host groups we have currently defined—from the frontend, open Configuration | Host groups:

The first thing that catches the eye is that the Templates group seems to have a large number of templates already. These are provided as examples so that you can later quickly reference them for some hints on items. We'll ignore these for now. We can also see an empty Discovered hosts group and the Zabbix servers group, which contains a single example host. The interesting part is in the first half of the table—we can see both groups we used along the way, with all the corresponding members. This table is fairly simple, with just a group name, a count of the number of group members (individually denoting hosts and templates contained in the group), and individual members being listed.
As can be seen, individual members are color coded, in the following convention:
- Green: Normal, enabled host
- Red: Normal, disabled host
- Gray: Template
Let's create Another Host group and assign some hosts to it. Click on the Create host group button. Enter Test group in the Group name field, and then select Linux servers from the Group dropdown above the Other hosts listbox. From the filtered list, select our custom-created hosts: A test host and Another host. You can use the Ctrl and Shift keys to select multiple entries. When you have these hosts selected, click on the ![]() button.
button.
Now, select SNMP devices from the Group dropdown and select SNMP device; then, click on the ![]() button again:
button again:
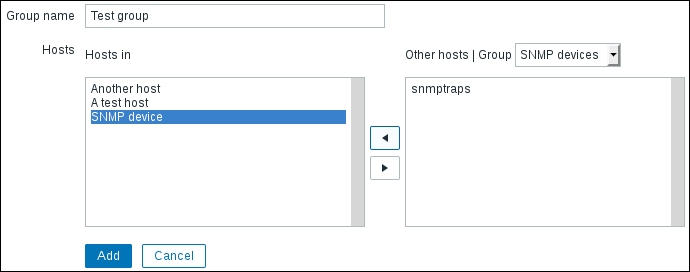
This form allows the easy selection of any number of hosts to add when a new group is created. You can freely move hosts from one box to another until you are satisfied with the result. When you are done, click on Add.
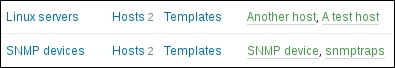
A new group will now appear in the list. As you can see, it contains the three hosts we just added:
But wait! The Linux servers and SNMP devices groups have two hosts each:
Right, we forgot to add the snmptraps host. Move your mouse cursor over it—notice how this (and every other host on this page) is a link. Clicking on it will take you to host details, so do that now. As we can see on the host editing form, it is already in one group: SNMP devices. Click on Test group in the Other groups listbox, and then click on the ![]() button:
button:
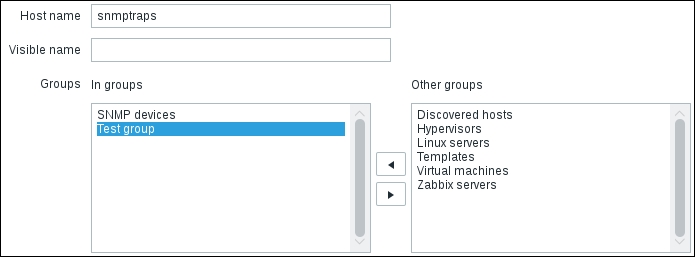
When you are done, click on Update.
You have probably guessed by now that a host can belong to any number of groups. This allows you to choose grouping based on any arbitrary decision, such as having a single host in groups called Linux servers, Europe servers, and DB servers.
Now, we are back in the host list, so return to the host group list by navigating to Configuration | Host groups. Test group contains four hosts, as it should. Let's say you want to disable a whole group of hosts, or even several host groups. Perhaps you have a group of hosts that are retired but which you don't want to delete just yet, or maybe you want to disable hosts created for testing when creating an actual production configuration on the Zabbix server. The group listing provides an easy way to do that: mark the checkboxes next to the Linux servers and SNMP devices entries, click on the Disable hosts button at the bottom of the list, and confirm the popup.
After this operation, all green hosts should be gone—they should be red now, indicating that they are in a disabled state.
This time, you could also have only marked the checkbox next to Test group, as Linux servers and SNMP devices are subsets of Test group, and the final effect would be the same. After doing this, we should remember that snmptraps is a generic SNMP trap-receiving host, which probably should be left enabled. Again, click on it to open the host details editing page.
While we have the host details page open, we can take a quick look at the interface section. As you can see, there are four different interface types available. For each of them, a single IP and DNS field is available, along with Connect to controls, which are used for checks initiated from the server side. We've already used Agent and SNMP interfaces. We will also use IPMI and JMX interfaces when configuring monitoring using those protocols.
Mark the Enabled checkbox and click on Update:
You should now see a host list with one disabled host (indicated by red text saying Disabled in the STATUS column) and one enabled host (indicated by green text saying Enabled in the STATUS column). Let's re-enable the SNMP device—click on the Disabled text next to it and confirm the popup. That leaves us with two enabled devices on the list. Select Linux servers from the Group dropdown, mark the checkboxes next to the two still-disabled hosts, click on the Enable button at the bottom of the list, and confirm the popup. Finally, we are back to having all the hosts enabled again. We used four methods to change the host state here:
- Changing the state for the whole group in the Configuration | Host groups area
- Changing the state for a single host using the Enabled checkbox in that host's properties page
- Changing the state for a single host using controls for each host in the STATUS column in the host configuration list
- Changing the state for a single host or multiple hosts by marking the relevant checkboxes in the host configuration list and using the buttons at the bottom of the list
We created the previous host group by going through the group configuration screen. As you might remember, another way is to use the New group field when creating or editing a host—this creates the group and simultaneously adds the host to that group.
The host list on the configuration screen is also useful in another way. It provides a nice and quick way of seeing which hosts are down. While the monitoring section gives us quite extensive information on the state of specific services and the conditions of each device, sometimes you will want a quick peek at the device status, for example, to determine the availability of all the devices in a particular group, such as printers, routers, or switches. The configuration provides this information in a list that contains almost no other information to distract you. If we were to now select All from the Group dropdown, we would see all the hosts this installation has:
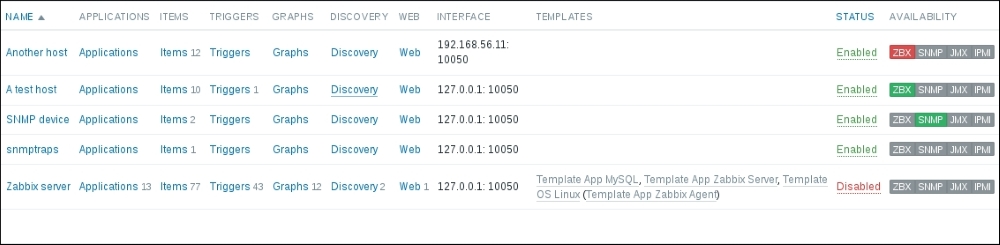
This time, we are interested in two columns: STATUS and AVAILABILITY. From the previous screenshot, we can see that we have one host that is not monitored, and this information is easily noticeable—printed in red, it stands out from the usual green entries. The AVAILABILITY column shows the internal state, as determined by Zabbix, for each host and polled item type. If Zabbix tries to get data from a host but fails, the availability of that host for this specific type of information is determined to be absent, as has happened here with Another host. Both the availability status and error message are preserved for the following four separate types of items polled by the Zabbix server:
- Zabbix agent (passive)
- SNMP
- JMX
- IPMI
On the other hand, the availability of the snmptraps host is unknown for all polled item types, as Zabbix has never tried to retrieve any data from it (that is, there are no items configured for it that the Zabbix server polls). Again, both unknown and unavailable hosts visually differ from the available ones, providing a quick overview.
Tip
Remember that the availability icon in the host list represents passive Zabbix agent items only—active items do not affect it at all. If a host has active items only, this icon will stay gray. If you add passive items that fail and then convert them all to active items, the icon should turn back to gray. This is an improvement in Zabbix 3.0; in previous versions, the icon would stay red throughout.
Availability information is aimed more at Zabbix administrators—it shows problems related to gathering data from a host, not information such as resource usage, process status, or performance metrics.
That just about wraps it up for host and host group management in Zabbix. Host group usefulness extends a bit past frontend management, though—we'll see how exactly later in this chapter, when we talk about permissions.
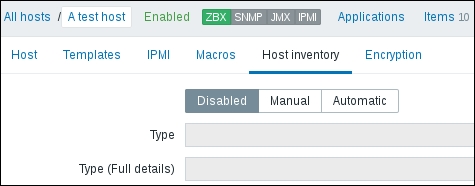
We looked at managing hosts, but there's one area of host properties that warrants a slightly longer view. Go to Configuration | Hosts, and make sure Linux servers has been selected in the Group dropdown. Then, click on A test host, and switch to the Host inventory tab. By default, the inventory is set to Disabled:
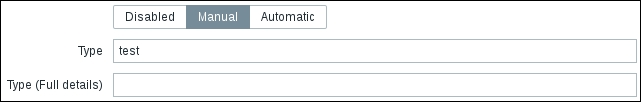
Click on Manual to enable the inventory fields. Notice how there are a lot of fields, starting with simple things such as type, name, operating system, and hardware, and ending with hardware maintenance dates, location data, and point-of-contact information. In the Type field, enter test, and then click on Update:
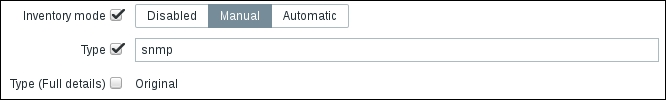
Now click on Another host, switch to the Host inventory tab, and click on Manual. Then, enter the same test string in the Type field again. Click on Update. Now, let's switch to SNMP devices in the Group dropdown. Mark the checkboxes next to both hosts and click on Mass update at the bottom of the list. In the Mass update form, switch to the Inventory tab and mark the checkbox next to Inventory mode. Switch to Manual, mark the checkbox next to Type, and enter snmp in that field:
Click on Update. With some inventory data populated, let's go to Inventory | Overview. Choose All from the Group dropdown and Type from the Grouping by dropdown. Notice how we can see all the available values for this field and how many hosts we have for each of them:

Click on the number 2 in the HOST COUNT column next to snmp. Here, we can see individual hosts and some of the inventory fields, including the field that we used, TYPE:
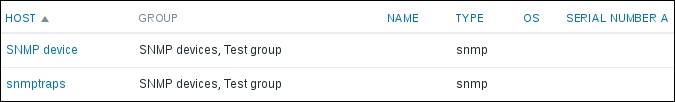
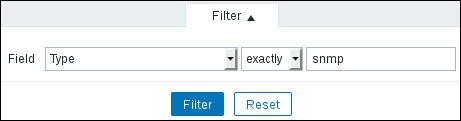
This list was filtered to show only those hosts that have the exact string snmp in the Type field. You can verify that by looking at the filter:
Collapse the filter and click on SNMP device in the HOST column. This will open the host overview page, displaying some basic configuration information. Notably, host interfaces are displayed here. While users without configuration permissions on hosts are not able to open host properties in the configuration section, they may see this host overview page and see the host interfaces this way:
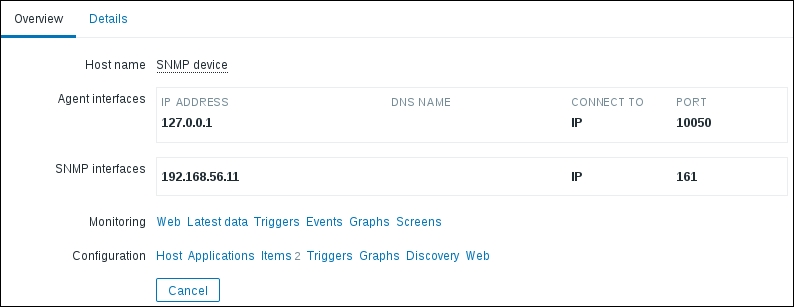
There are also two lines of links at the bottom of this form: Monitoring and Configuration. As one might expect, they provide quick access to various monitoring and configuration sections for this host, similar to the global search we discussed in Chapter 2, Getting Your First Notification. Clicking on Host name will provide access to global scripts. We will explore and configure those in Chapter 7, Acting upon Monitored Conditions.
Let's return to Configuration | Hosts and click on SNMP device. Switch to the Host inventory tab, and in the OS field, enter Linux (http://www.kernel.org) and click on Update. Let's go directly to Inventory | Hosts this time—notice how this was the page we ended at when we clicked on the host count from the inventory overview. Looking at the OS column, we can see that Zabbix recognized the URL and made it clickable:

This allows you to link to websites that provide more information or to web management interfaces for various devices. Note that other than recognizing URLs, fields are not interpreted in any way; for example, Location latitude and Location longitude fields are just text fields.
Manually populated inventory data is useful, but doing that on a large scale may not be very feasible. Zabbix can also collect some inventory values automatically for us. This is possible as any item may populate any inventory field. We will use one of our existing items and create a new one to automatically populate two inventory fields.
Let's start by adding the new item. Navigate to Configuration | Hosts, switch to Linux servers from the Group dropdown, and click on Items for A test host. Then, click on Create item. Fill in the following values:
- Name: The full OS name
- Key:
system.uname - Type of information: Text
- Update interval:
300
When you're done, click on the Add button at the bottom. Let's modify another item to place data in yet another inventory field. Click on the Zabbix agent version, then choose Software application A from the Populates host inventory field dropdown, and click on Update. We now have two items configured to place data in inventory fields, but this alone won't do anything—we have our inventory set to manual mode. From the navigation bar above the item list, click on A test host and switch to the Host inventory tab. Then, choose Automatic. Notice how something changed—a couple of fields here got disabled, and links appeared to the right of them:
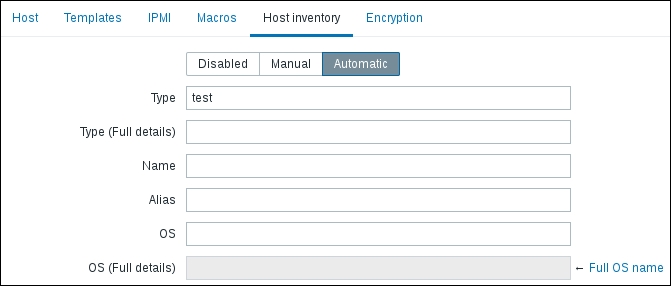
These are the fields we chose during the item configuration earlier. The links show which items are supposed to populate these fields and allow convenient access to the configuration of those items. Note that the field we manually populated earlier, Type, did not lose the value. Actually, the automatic mode can be said to be a hybrid one. Fields that are configured to obtain their values automatically do so; other fields may be populated manually. Click on Update.
Values from items are placed in the inventory whenever an item gets a new value. For the full OS version item, we set the interval to a fairly low one: 300 seconds. The agent one, on the other hand, has a large interval. This means that we might have to wait for a long time before the value appears in that inventory field. To make it happen sooner, restart the agent on A test host.
The inventory field we chose, Software application A, is not very representative, but there is no way of customizing inventory fields at this time. If you have data that does not match existing inventory fields well, you'll have to choose the best fit—or just use something not very much related to the actual data.
With two items supposed to have their values placed in the inventory fields, let's return to Inventory | Overview and choose Software application A from the Grouping by dropdown. This should display only one host, for the agent version 3.0.0. Click on 1 in the HOST COUNT column, and you should be able to see that, as expected, it is A test host. The column we chose is not listed in the current view, though. Click on A test host in the HOST column and switch to the Details tab:

Here, we can see system information from the system.uname item and the agent version from the agent.version item.
We used both the overview and host pages of the inventory section. The overview is useful to see the distribution of hosts by inventory field. The host page allows seeing individual hosts while filtering by host group and filtering by a single inventory field. When we ended up on the hosts page, the filter was preset for us to match an exact field value, but we may also search for a substring. For example, if we have systems with OS information containing CentOS 5.5 and CentOS 6.2, we may filter just by CentOS and obtain a list of all the CentOS systems, no matter which exact version they are running.
While being able to access inventory data in the frontend is useful sometimes, faster and easier access might be preferred. It is also possible to include inventory data in notifications. For example, sent e-mail could include system location, whom to contact when there's any problem with the system, and some serial numbers among other things. We will discuss notifications in Chapter 7, Acting upon Monitored Conditions.
We want to know about problems as soon as possible, always. Well, not always—there are those cases when we test failover or reconfigure storage arrays. There is also maintenance—the time when things are highly likely to break and we do not want to send loads of e-mails, SMS messages, and other things to our accounts or to other people. Zabbix offers host group and host-level maintenance that enables us to avoid excessive messaging during such maintenance periods.
Hosts being under maintenance can result in three main consequences:
These consequences can also be customized in quite some detail per host group, host, and other factors. We will explore most of those customization possibilities in this chapter, except alert processing—we will discuss that in Chapter 7, Acting upon Monitored Conditions.
We will create a couple of maintenance periods and see how they affect several views in the frontend. We will discuss the available time period options and set up two different maintenance periods:
- One that will not affect data collection
- One that stops data collection
Navigate to Configuration | Maintenance and click on Create maintenance period. In the resulting form, fill in these values:
- Name: Enter
Normal maintenance - Active since: Make sure this is set to the start of your current day or earlier
- Active till: Make sure this is set to a year or so in the future
- Description: Enter
We keep data during this maintenance

What's that, are we really creating a year-long maintenance period? Not really. Switch to the Periods tab.
Here, Zabbix terminology is a bit confusing. The main tab has since–till fields, which allow us to set what we could call the main period. The Periods tab allows us to add individual periods, and we could call them subperiods. Any maintenance entry in Zabbix must have at least one subperiod defined. Maintenance in Zabbix is active when the main period overlaps with the subperiods. Let's repeat that:
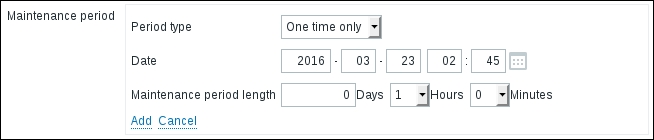
We should not add a maintenance entry without any subperiods defined. Zabbix 3.0.0 has a minor regression where this is actually possible—it is hoped that this will be fixed in further releases. No subperiods are defined here yet, so let's click on New. To keep things simple here, let's add a one time period. In the Date field, set the date and time to the current values. We can leave the Maintenance period length at the default, which is 1 hour:
When you're done, click on the small Add link below the Maintenance period section—do not click on the Add button yet. Only after clicking on that small Add link should you click on the Add button—an error should appear:

That didn't seem to work too well—apparently, a maintenance entry without any hosts or groups assigned to it can not be created. Switch to the Hosts & Groups tab. For our first maintenance period, make sure the Group dropdown in the Other hosts section says Linux servers, and choose A test host. Then, click on the ![]() button:
button:

With the problem—a missing host or host group—solved, let's click on Add again. The maintenance entry should appear in the list:

Tip
The reminder to click on the small Add link was not repeated several times for no reason—it is too easy to forget to click on it and actually miss your changes in some cases. For example, if you were adding the second subperiod and forgot to click on the small link, it would be silently discarded. Watch out for similar traps in other forms.
With the maintenance entry added, let's try to see the effect this has on several sections in the frontend. In the console, run this:
$ cat /dev/urandom | md5sum
Navigate to Monitoring | Triggers and wait for the trigger to fire. When it shows up, look at the HOST column—this time, there's an orange wrench indicator. This shows us that maintenance is currently active for this host. Move the mouse cursor over this indicator:

The message shows the name of the maintenance we used: Normal maintenance. It also tells us that this maintenance is configured to keep collecting data, and below, that the description of the maintenance is shown. This allows us to easily inform other users about why this maintenance is taking place. Still on the trigger page, look at the filter. Notice how the Show hosts in maintenance checkbox is marked by default. Unmark it and click on Filter. All problems for A test host should disappear—well, from this view at least. To avoid being confused later, mark that checkbox and click on Filter again. Remember, most filter options are remembered between visits to a specific page, so we will not see hosts in maintenance in this view later if we leave it marked.
Let's check how another page looks when a host is in maintenance. Navigate to Monitoring | Dashboard and check the Last 20 issues widget:
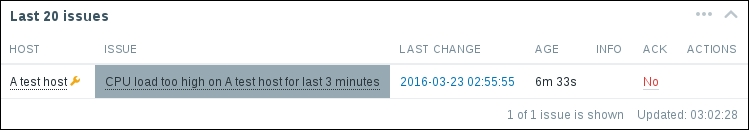
The host that is under maintenance is denoted here in the same way. Again, moving the mouse cursor over the orange icon will reveal the maintenance name, type, and description. We can also hide hosts in maintenance from the dashboard—click on the wrench icon in the upper-right corner to open the dashboard filter. In the filter, click on Disabled at the top, and then unmark the checkbox labeled Show hosts in maintenance:
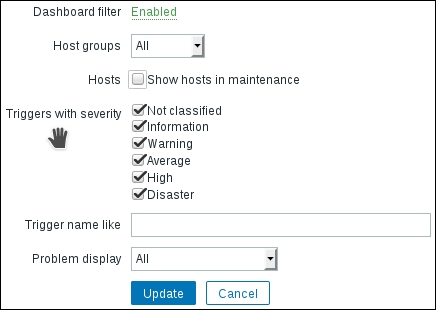
When done, click on Update. Notice how the problem is gone from the Last 20 issues widget. Click on the wrench icon again (it has a green dot now to indicate that this filter is active), click on Enabled to disable it, and then click on Update.
The maintenance status can also be seen in other frontend sections. We will review some of them in Chapter 9, Visualizing the Data with Graphs and Maps.
We created and checked one maintenance entry. During this maintenance, data from our host was still collected, and triggers were checking that data. The status was shown in the frontend, and we could choose to hide hosts that were in maintenance. Now, let's try something different—maintenance that also stops data from coming in.
Navigate to Configuration | Maintenance and click on Create maintenance period. In the resulting form, fill in these values:
- Name: Enter
Maintenance with all data dropped - Maintenance type: Choose No data collection
- Active since: Make sure this is set to the start of your current day or earlier
- Active till: Make sure this is set to a year or so in the future
- Description: Enter
We don't need no data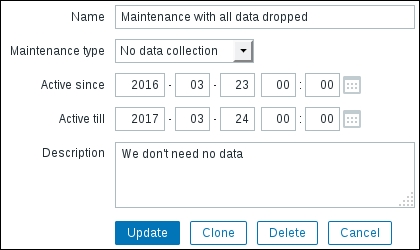
Switch to the Periods tab and click on New. In the Date field, set the date and time to the current values:

Click on the small Add link—again, that one first, not the Add button. Now, switch to the Hosts & Groups tab. Make sure the Group dropdown in the Other hosts section says Linux servers, and choose Another host. Then, click on the ![]() button. Now, click on the large Add button. There should be two maintenance entries in the list now:
button. Now, click on the large Add button. There should be two maintenance entries in the list now:

Go to Monitoring | Latest data, and make sure Linux servers is selected in the Host groups field in the filter. Notice how data stopped coming in for the items in Another host—the timestamp is not being updated anymore. That's because of the maintenance without data collection that we created. As such, triggers will not fire, and problems for such hosts will not appear in the frontend, no matter what the filter settings are.
Let's take a quick look at Configuration | Hosts. This is another location where the maintenance status can be seen. Hosts that are in maintenance will have In maintenance listed in the STATUS column—this replaces the normal Enabled text:

We discovered the way maintenance can affect data collection and the displaying of problems. Another important reason to use it is skipping or modifying notifications. We will discuss notifications in Chapter 7, Acting upon Monitored Conditions.
So far, the only type of maintenance subperiods we've used is one-time maintenance. We decided to call those periods that were configured in a separate tab "subperiods" to distinguish then from the main period, configured in the first tab, Maintenance. We also discovered that maintenance would be active only during the time for which the main period overlaps with the subperiods. But what's the point of defining the same thing twice; couldn't the one-time period be the only thing to specify? The benefit of the main period becomes more apparent when configuring recurring maintenance, so let's explore the options available for subperiods. You may navigate to Configuration | Maintenance, start creating a new maintenance, and play with the available subperiods as we explore them.
This is the maintenance subperiod type we've already used. It starts at the specified date and time, proceeds for the amount of time specified in minutes, hours, and days, and that's it. This type of subperiod must still overlap with the main period.
For daily maintenance, we have to specify the starting time and the length of the maintenance period:

During the main period, maintenance will start every day at the specified time. It will start every day with the Every day(s) option set to the default, 1. We can change this and make the maintenance only happen every second day, third day, and so on.
For weekly maintenance, we have to specify the starting time and the length of the maintenance period, the same as for daily maintenance:

We also have to choose on which days of the week the maintenance will take place—we can choose one or more. During the main period, maintenance will start every specified day of the week at the specified time. It will start every week with the Every week(s) option set to the default, 1. We can change this and make the maintenance only happen every second week, third week, and so on.
Monthly maintenance has two modes:
- By day (or by date)
- By day of week
For both of these, we have to specify the starting time and the length of the maintenance period, the same as in daily and weekly maintenance modes. Additionally, we have to choose which months the maintenance will happen in—we may choose one month or more. In the day or date mode (option Date set to Day), we have to enter a date in the Day of month field. Maintenance will happen on that date only in each of the months we select:
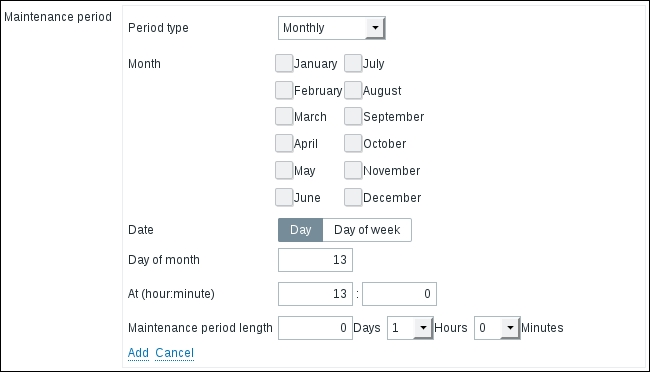
In the day-of-week mode (option Date set to Day of week) we have to choose which days of the week the maintenance will take place on—we may choose one or more:

As this has to happen monthly, not weekly, we also have to choose whether this will happen on the First, Second, Third, Fourth, or Last such weekday in any of the selected months:

In addition to these, we may also ask Zabbix to run this maintenance on the last such day in the selected months, for example, every April, August, and December, to run the maintenance on the last Wednesday that month.
With all these recurring maintenance modes, it is possible to create nearly any scenario—one thing that might be missing is the ability to run monthly maintenance on the last day of every month.
So, the benefit of having this sort of a double configuration, this overlap between the main period and the subperiods, is that we can have a recurring maintenance that starts at some point in the future and then stops at some point later completely automatically—we don't have to remember to add and remove it at a specific date.
The maintenance functionality in Zabbix is aimed at a well-planned environment where maintenance is always planned in advance. In practice, people often enough want to place a host in maintenance quickly and then simply remove it manually a bit later. With all the periods and other things maintenance entry requires, it's not quick enough. A slightly hackish workaround is to create a new host group and maintenance period that is always active (make sure to set its end date far enough in the future). Include that host group in the maintenance entry, and then, adding a host to the chosen host group will add that host to maintenance. Of course, one will have to remember to remove the host from the host group afterwards.