
Now that we know more about triggers, let's see what we can do when they fire. Just seeing some problem on the frontend is not enough; we probably want to send notifications using e-mail or SMS, or maybe even attempt to remedy the problem automatically.
Actions make sure something is done about a trigger firing. Let's try to send notifications and automatically execute commands.
In this chapter, we will:
- Learn how to limit conditions when alerts are sent
- Send notifications
- Escalate once a threshold is reached
- Use scripts as media
- Integrate with issue manager
- Understand global scripts
The trigger list would be fine to look at, way better than looking at individual items, but that would still be an awful lot of manual work. That's where actions come in, providing notifications and other methods to react upon condition change.
The most common method is e-mail. If you had an action set up properly when we first configured a fully working chain of item-trigger-action in Chapter 2, Getting Your First Notification, you received an e-mail whenever we started or stopped a service, created the test file, and so on. Let's look at what actions can do in more detail.
Our previous action, created in Chapter 2, Getting Your First Notification, matched any event, as we had not limited its scope in any way. Now we could try matching only a specific condition. Navigate to Configuration | Actions, then click on Create action.
In the Name field, enter SNMP action. Now switch to the Conditions tab. By default, there are two conditions already added—why so?
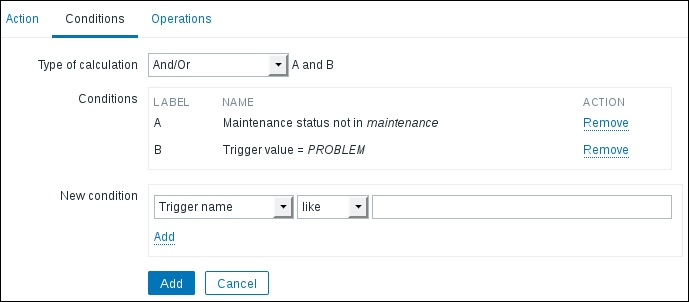
The conditions here are added because they are likely to be useful for a new action for most users:
- Maintenance status not in maintenance: This condition ensures that during active maintenance, no operations will be performed. It can be safely removed to ignore maintenance. For example, technical experts might want to receive notifications even during active maintenance, but helpdesk members may not.
- Trigger value = PROBLEM: This condition ensures that the action will only do something when the problem happens. The trigger value would also have been OK when the trigger resolves, but this condition will make the action ignore the recovery events. While it might seem tempting to remove this condition to get notifications when problems are resolved, it is not suggested. We will discuss a better recovery message option later in this chapter.
Would somebody want to remove the trigger value condition? Yes, there could be a case when a script should be run both when a problem happens and when it is resolved. We could remove this condition, but in that case escalations should not be used. Otherwise, both problem and recovery events would get escalated, and it would be very, very confusing:

For our action right now, let's leave the default conditions in place and move to operations. Operations are the actual activities that are performed. Switch to the Operations tab and click on the New link in the Action operations block. To start with, we will configure a very simple action—sending an e-mail to a single USER GROUP. This form can be fairly confusing. Click on Add in the Send to User groups section, and in the upcoming window click on Our users. The result should look like this:

Now click on the main Add link in the Operation details block (just below the Conditions section). Finally, click on the Add button at the bottom. As we want to properly test how e-mails are sent, we should now disable our previously added action. Mark the checkbox next to the Test action, click on the Disable button at the bottom, then confirm disabling in the popup.
Now we need triggers on our SNMP trap items. Navigate to Configuration | Hosts, click on Triggers next to snmptraps, and click on Create trigger. Enter the following:
- Name:
SNMP trap has arrived on {HOST.NAME} - Expression:
{snmptraps:snmptraps.nodata(30)}=0 - Severity: Information
Such a trigger will fire whenever a trap arrives, and clear itself approximately 30 seconds later. We discussed the nodata() trigger function in Chapter 6, Detecting Problems with Triggers. When done, click on the Add button at the bottom.
We will also want to have a trigger fire on Another host. Let's copy the one we just created—mark the checkbox next to it and click on Copy. Choose Hosts in the Target type dropdown, Linux servers in the Group dropdown and select Another host:

When done, click on Copy.
There's still one missing link—none of the two users in the Our users group has user media defined. To add media, navigate to Administration | Users and click on monitoring_user in the ALIAS column. Switch to the Media tab and click Add, enter the e-mail address in the Send to field, then close the popup by clicking on Add. We now have to save this change as well, so click on Update.
Now we have to make a trigger fire. Execute the following from Another host:
$ snmptrap -Ci -v 2c -c public <Zabbix server> "" "NET-SNMP-MIB::netSnmpExperimental" NET-SNMP-MIB::netSnmpExperimental s "Critical Error"
Tip
See Chapter 4, Monitoring SNMP Devices, for information on receiving SNMP traps.
Replace <Zabbix server> with the IP or DNS name of the Zabbix server. This value should end up in the snmptraps item in Another host and make the associated trigger fire. You can verify that the trigger fires in the Monitoring | Triggers section:
Then send another trap from Another host:
$ snmptrap -Ci -v 2c -c public <Zabbix server> "" "NET-SNMP-MIB::netSnmpExperimental" NET-SNMP-MIB::netSnmpExperimental s "Critical Error"
As Another host has no snmptraps item anymore, this value should go to the snmptraps host instead. By now, we should have received an e-mail from our new action. Let's check out another view—the event view. Open Monitoring | Events and, take a look at the last few entries:

We can see that three events have been successfully registered by now—first, the SNMP trap item reporting an error on Another host, then resolving it, and last, trigger on the snmptraps host has fired. But the last column, titled ACTIONS, is notably different. While the first PROBLEM event has some numbers listed, the most recent one has nothing. So here's why.
The snmptraps host was in the important SNMP host group, and permissions on it for our user group were explicitly set to deny.
That allows us to overlap host group permissions with action conditions to create quite sophisticated notification scenarios.
So far, we have only used the two default action conditions. Actually, Zabbix provides quite a lot of different conditions that determine when an action is invoked. Let's look at some examples of what other conditions are available:
- Application: Allows us to limit actions to specific applications. For example, an action could only react when items belonging to the MySQL application are involved. This is a freeform field, so it must match the actual application name. We may also match or negate a substring.
- Host: Allows us to single out an important (or unimportant) host for action invocation.
- Host group: Similar to the Host condition, this one allows us to limit based on the host group membership.
- Trigger: This condition allows us to match individual, specific triggers.
- Trigger name: A bit more flexible than the previous one, with this condition we can limit invocation based on trigger name—for example, only acting upon triggers that have the string
databasein their names. - Trigger severity: We can limit the action to only happen for the highest two trigger severities, or maybe only for a couple of the lowest severities.
- Time period: Operations can be carried out only if a problem has happened in a specified time period, or they can be suppressed for a specified time period instead.
There are more action conditions that are useful in specific use cases—check the list in the action condition configuration to be able to use them later.
In the action properties, in the Conditions tab, there was also a Type of calculation dropdown at the very top. It appears when the action has two or more conditions, thus for us it was always present—the default action came with two conditions already. Let's find out what functionality it offers:

- And: All the conditions must be true for the action to match
- Or: It is enough for one condition to be true for the action to match
- And/Or: Conditions of the same type are evaluated as
Or; conditions of different types are evaluated asAnd - Custom expression: Full freedom option—you write a formula to define how the conditions should be evaluated
The first two options are clear enough. And/Or automatically creates the expression and the logic is based on condition types. For example, if we have the following conditions:
- A:
Application = MySQL - B:
Application = PostgreSQL - C:
Trigger severity = High - D:
Host group = Database servers
Option And/Or would create a formula (A or B) and C and D. This works in a lot of situations, but we might now add another condition for a Host group like this:
- E:
Host group = Production servers.
The formula would be (A or B) and C and (D or E). The new Host group condition, being the same type, is "or-ed" with the previous Host group condition. It is probably not what the user intended, though. In this case, the desired condition was hosts that are both in the database server and production server groups. The and/or option does not help here anymore, so we can use a Custom expression. In this case, we would simply type the formula in the provided input field:
(A or B) and C and (D and E)
Grouping for D and E here is optional; we added it only for clarity.
Tip
The situation is even more complicated when negating some conditions. If one would like to skip an action in case some problem happens for a host either in group A or group B, having two not host group conditions such as (A and B) wouldn't work—it would only match if a host was in both groups at the same time. Making the expression check for (A or B) would match unless a host is in both host groups again. For example, if the problem happens on a host that's in group A, Zabbix would check that the host matched the first condition. It would tell that the action shouldn't be performed—but there's the second part with or. The host wouldn't be part of group B, and thus the action would be performed. Unfortunately, there's no simple solution for such cases. Creating two actions, each only negating a single host group, would work.
Another way to limit the notifications sent is trigger dependencies, which come in really handy here. If a trigger that is dependent on an already active trigger fires, we have seen the effect on the frontend—the dependent trigger did not appear in the list of active triggers. This is even better with actions—no action is performed in such a case. If you know that a website relies on a Network File System (NFS) server, and have set a corresponding dependency, the NFS server going down would not notify you about the website problem. When there's a problem to solve, not being flooded with e-mails is a good thing.
There's a possible race condition if the item for the dependent trigger is checked more often. In such a case, the dependent trigger might fire first, and the other one a short time later, thus still producing two alerts. While this is not a huge problem for the trigger displaying in the frontend, this can be undesirable if it happens with actions involved. If you see such false positives often, change the item intervals so that the dependent one always has a slightly longer interval.
We looked at what limits an action can impose, but there are also possible limits per media. Navigate to Administration | Users and click on Admin in the ALIAS column. Switch to the Media tab and click on Edit next to the only media we have created here:
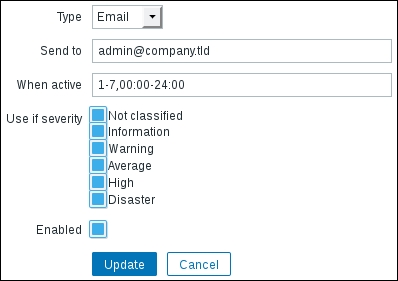
When considering limits, we are mostly interested in two sections here—When active and Use if severity.
As the name indicates, the first of these allows us to set a period when media is used. Days are represented by the numbers 1-7 and a 24-hour clock notation of HH:MM-HH:MM is used. Several periods can be combined, separated by semicolons. This way it is possible to send an SMS to a technician during weekends and nights, an e-mail during workdays, and an e-mail to a helpdesk during working hours.
For example, a media active period like this might be useful for an employee who has different working times during a week:
1-3,09:00-13:00;4-5,13:00-17:00
Notifications would be sent out:
- Monday to Wednesday from 09:00 till 13:00
- Thursday and Friday from 13:00 till 17:00
Use if severity is very useful as well, as that poor technician might not want to receive informative SMS messages during the night, only disaster ones.
As both of the users specified in the action operations have explicitly been denied access to the snmptraps host, they were not considered valid for action operations.
Let's give them access to this host now. Go to Administration | User groups and click on Our users in the NAME column. Switch to the Permissions tab, then mark Important SNMP hosts in the DENY box, click on Delete selected below, then click on Update. Both users should have access to the desired host now.
Out triggers have been deactivated by now, so we can send another trap to activate the one on the snmptraps host.
Run the following commands on Another host:
$ snmptrap -Ci -v 2c -c public <Zabbix server> "" "NET-SNMP-MIB::netSnmpExperimental" NET-SNMP-MIB::netSnmpExperimental s "Critical Error"
Wait for a while so that the trigger fires again. Check your e-mail, and you should have received a notification about the host that we previously were not notified about, snmptraps. Let's see the event list again—open Monitoring | Events and look at the latest entry:

Tip
If the ACTIONS column shows a number in an orange color, wait a couple more minutes. We will discuss the reason for such a delay in Chapter 22, Zabbix Maintenance.
Oh, but what's up with the weird entry in the ACTIONS column? Those two differently colored numbers look quite cryptic. Let's try to find out what they could mean—open Reports | Action log and look at the last few entries:
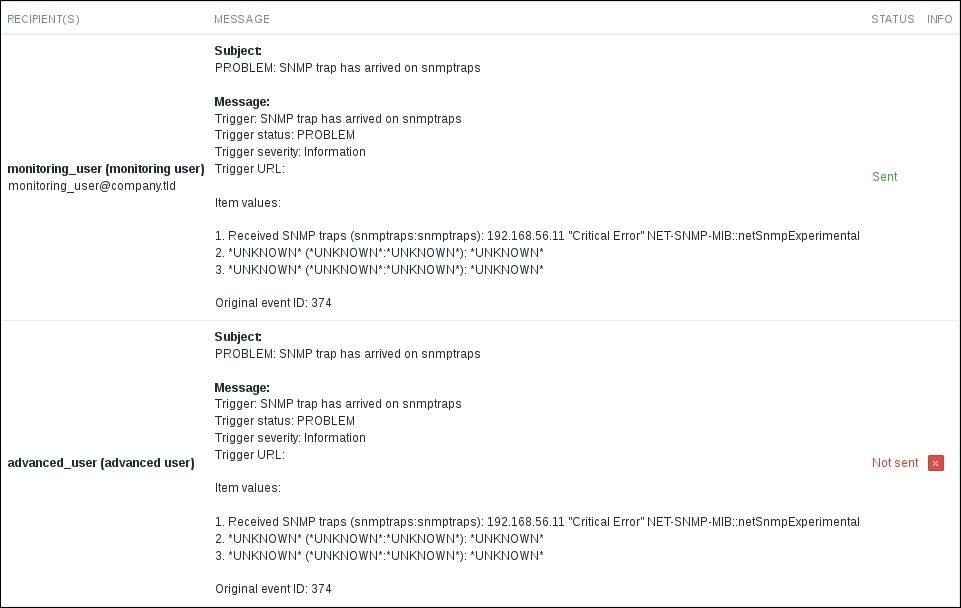
The STATUS column says that sending the message succeeded for the monitoring_user, but failed for the advanced_user. Thus, green numbers in the event list mean successfully sent notifications, while red numbers mean failures. To see why it failed, move the mouse cursor over the red X in the INFO column:

Excellent, that clearly explains what the error is—our advanced_user had no media entries defined. We can easily deduce that numbers in the event list represent notification counts—green for successful ones and red for unsuccessful ones. It also shows us that actions should not be configured to send messages for users that do not have media correctly set, as such entries pollute the action log and make it harder to review interesting entries.
While the Action log provides more detail, we could have found out the error in the event list as well. Return to Monitoring | Events, and move the mouse cursor over the red, rightmost number 1 in the ACTIONS column. A popup appears. Click on the number 1 to make the popup stay and move the mouse cursor over the red X in the INFO column—the same informative popup will appear, in this case telling us that there's no media defined for this user.
Let's take a careful look at the e-mails we received (if you have already deleted them, just send a couple more SNMP traps). The subject and body both mention the trigger name SNMP trap has arrived on snmptraps. Looks like it was a good idea to include the host name macro in the trigger name. While there's another solution we will explore right now, a general suggestion is to always include the host name in the trigger name. Doing so will avoid cases when you receive an alert, but have no idea which host has the problem. For example, if we had omitted the host name macro from our trigger, the e-mail alerts would have said SNMP trap has arrived.
Another solution is possible for the aforementioned problem—we can use the macro in the action to help in this particular case. To proceed, navigate to Configuration | Actions, click on SNMP action in the NAME column, then change the Default subject field contents to:
{TRIGGER.STATUS}: {TRIGGER.NAME} on {HOST.NAME}The field already contained two macros—{TRIGGER.STATUS} and {TRIGGER.NAME}. The benefit of a macro is evident when we have a single action covering many cases. We don't have to create a myriad of actions to cover every possible situation; instead we use macros to have the desired information, related to the particular event, replaced. Macro names usually provide a good idea of what a macro does. In this case, we improved the existing subject line, which already contained trigger name and status macros, by adding the host name macro, though it is still recommended to include the host name in trigger names.
To confirm your changes, click on Update. Make the trigger change state by sending SNMP traps like before, then check your e-mail. The subject now includes the host name. But wait, now the host name is included twice—what have we done? The subject is now:
PROBLEM: SNMP trap has arrived on snmptraps on snmptraps
We used the same macro in the trigger name and in the action subject. You should decide where you would like to specify the host name and always follow that rule.
There's also something else slightly strange in the e-mails—at the end of the message body, there are some lines with UNKNOWN in them:
Received SNMP traps (snmptraps:snmptraps): 192.168.56.11 "Critical Error"   NET-SNMP-MIB::netSnmpExperimental
*UNKNOWN* (*UNKNOWN*:*UNKNOWN*): *UNKNOWN*
*UNKNOWN* (*UNKNOWN*:*UNKNOWN*): *UNKNOWN*
If we now look at the corresponding action configuration:
Item values:
{ITEM.NAME1} ({HOST.NAME1}:{ITEM.KEY1}): {ITEM.VALUE1}
{ITEM.NAME2} ({HOST.NAME2}:{ITEM.KEY2}): {ITEM.VALUE2}
{ITEM.NAME3} ({HOST.NAME3}:{ITEM.KEY3}): {ITEM.VALUE3}
The number that is appended in these macros, such as in {ITEM.NAME1}, is the sequential number of the item in the trigger expression. The trigger that sent the notifications for us referenced a single item only, thus the first reference works, referencing the second and third items fails, and that outputs *UNKNOWN* in the message. The default action is meant to be used as an example—in this case, demonstrating the ability to reference multiple items. If most of your triggers reference only a single item, it might be desirable to remove the second and the third lines. At this time, there is no way to conditionally print the item value, if it exists.
Sometimes, the receiver of the message might benefit from additional information that's, not directly obtainable from event-related macros. Here, an additional class of macros helps—the ones used in trigger expressions also work for macro contents. Imagine a person managing two servers that both rely on an NFS server, which is known to have performance problems. If the system load on one of these two servers increases enough to fire a trigger, the alert receiver would want to know the load on the second server as well, and also whether the NFS service is running correctly. That would allow them to do a quick evaluation of where the problem most likely lies—if the NFS service is down or is having performance problems of its own, then the system load on these two servers most likely has risen because of that, and the NFS server admin will have to take care of that. For this person to receive such information, we can add lines these to the e-mail body:
CPU load on Another host: {Another host:system.cpu.load.last()}
NFS service is: {NFS Server:nfs.service.last()}Note, there is no built-in NFS service item—one has to create proper hosts and items to be able to reference them like this.
As can be seen in the example, the same syntax is used as in trigger expressions, including the functions supported. This also allows the receiver to be immediately informed about average load over a period of time by adding a macro such as this:
Average CPU load on Another host for last 10 minutes: {Another host:system.cpu.load.avg(600)}You can find a full list of supported macros in the official Zabbix documentation at https://www.zabbix.com/documentation/3.0/manual/appendix/macros/supported_by_location.
The setup we used only sent out messages when the problem happened. That was ensured by the Trigger value = PROBLEM condition, which was added by default. One way to also enable the sending of messages when a trigger is resolved would be to remove that condition, but it will not be useful when escalation functionality is used. Thus it is suggested to leave that condition in place and enable recovery messages on the action level instead.
Let's enable recovery messages for our SNMP trap action. Go to Configuration | Actions, click on SNMP action in the NAME column, and mark the Recovery message checkbox. Notice how this gives us two additional fields—we can customize the recovery message. Instead of sending similar messages for problems and recoveries, we can make recoveries stand out a bit more. Hey, that's a good idea—we will be sending out e-mails to management, let's add some "feel good" thing here. Modify the Recovery subject field by adding Resolved: in front of the existing content:

Click on the Update button. This will make the outgoing recovery messages have a sort of a double-affirmation that everything is good—the subject will start with Resolved: OK:. To test the new configuration, set the trap to generate a problem and wait for the problem to resolve. This time, two e-mails should be sent, and the second one should come with our custom subject.
In the e-mail that arrives, note the line at the very end that looks similar to this:
Original event ID: 1313
The number at the end of the line is the event ID—a unique identifier of the occurrence of the problem. It is actually the so-called original event ID. This is the ID of the original problem, and it is the same in the problem and recovery notifications. A very useful approach is automatically matching recovery messages with the problem ones when sending this data to an issue management or ticketing system—recovery information can be used to automatically close tickets, or provide additional information for them.
This ID was produced by a macro {EVENT.ID}, and, as with many other macros, you can use it in your actions. If you would want to uniquely identify the recovery event, there's yet another macro for that—{EVENT.RECOVERY.ID}.
There are a lot of macros, so make sure to consult the Zabbix manual for a full list of them.
We know how to perform an action if a threshold is reached, such as the temperature being too high, the available disk space being too low, or a web server not working. We can send a message, open a ticket in a tracker, run a custom script, or execute a command on a remote machine. But all these are simple if-then sequences—if it's this problem, do this. Quite often the severity of the problem depends on how long the problem persists. For example, a couple-of-minutes-long connection loss to a branch office might not be critical, but it's still worth noting down and e-mailing IT staff. The inability to reach a branch office for five minutes is quite important, and at this point we would like to open a ticket in the helpdesk system and send an SMS to IT staff. After 20 minutes of the problem not being fixed, we would e-mail an IT manager. Let's look at what tools Zabbix provides to enable such gradual activities and configure a simple example.
In the frontend, navigate to Configuration | Actions and click on Disabled next to the Test action in the STATUS column to enable this action, then click on Enabled next to the SNMP action. Now click on Test action in the NAME column. Currently, this action sends a single e-mail to user Admin whenever a problem occurs. Let's extend this situation:
- Our first user,
Admin, will be notified for five minutes after the problem happens, with a one-minute interval. After that, they would be notified every five minutes until the problem is resolved. advanced_useris lower-level management who would like to receive a notification if a problem is not resolved within five minutes.monitoring_useris a higher-level manager who should be notified in 20 minutes if the problem still is not resolved, and if it has not yet been acknowledged.
While these times would be longer in real life, here we are interested in seeing escalation in action.
Now we are ready to configure escalations. Switch to the Operations tab.
Looking at the operations list, we can see that it currently contains only a single operation—sending an e-mail message to the Admin user immediately and only once—which is indicated by the STEPS DETAILS column having only the first step listed:

The first change we would like to perform is to make sure that Admin receives notifications every minute for the first five minutes after the problem happens. Before we modify that, though, we should change the default operation step duration, which by default is 3600 and cannot be lower than 60 seconds. Looking at our requirements, two factors affect the possible step length:
- The lowest time between two repeated alerts—1 minute in our case.
- The biggest common divisor for the starting time of delayed alerts. In our case, the delayed alerts were needed at 5 and 20 minutes, thus the biggest common divisor is 5 minutes.
Normally, one would set the default step duration to the biggest common divisor of both these factors. Here, that would be 60 seconds—but we may also override step duration inside an operation. Let's see how that can help us to have a simpler escalation process.
Enter 300 in the Default operation step duration—that's five minutes in seconds. Now let's make sure Admin receives a notification every minute for the first five minutes—click on Edit in the Action operations block.
Notice how the operation details also have a Step duration field. This allows us to override action-level step duration for each operation. We have an action level step duration of 300 seconds, but these steps should be performed with one minute between them, so enter 60 in the Step duration field. The two Steps fields denote the step this operation should start and end with. Step 1 means immediately, thus the first field satisfies us. On the other hand, it currently sends the message only once, but we want to pester our administrator for five minutes. In the Steps fields, enter 6 in the second field.
The final result should look like this:

If it does, click on Update in the Operation details block—not the button at the bottom yet. Now to the next task—Admin must receive notifications every five minutes after that, until the problem is resolved.
We have to figure out what values to put in the Steps fields. We want this operation to kick in after five minutes, but notification at five minutes is already covered by the first operation, so we are probably aiming for 10 minutes. But which step should we use for 10 minutes? Let's try to create a timeline. We have a single operation currently set that overrides the default period. After that, the default period starts working, and even though we currently have no operations assigned, we can calculate when further steps would be taken:
|
Step |
Operation |
Interval (seconds) |
Time passed |
|---|---|---|---|
|
1 |
Send message to user |
Operation, 60 |
0 |
|
2 |
Send message to user |
Operation, 60 |
1 minute |
|
3 |
Send message to user |
Operation, 60 |
2 minutes |
|
4 |
Send message to user |
Operation, 60 |
3 minutes |
|
5 |
Send message to user |
Operation, 60 |
4 minutes |
|
6 |
Send message to user |
Operation, 60 |
5 minutes |
|
7 |
none |
Default, 300 |
6 minutes |
|
8 |
none |
Default, 300 |
11 minutes |
We wanted to have 10 minutes, but it looks like with this configuration that is not possible—our first operation puts step 7 at 6 minutes, and falling back to the default intervals puts step 8 at 11 minutes. To override interval 6-7, we would have to define some operation at step 7, but we do not want to do that. Is there a way to configure it in the desired way? There should be. Click on Edit in the ACTION column and change the second Steps field to 5, then click on Update in the Operation details block—do not click on the main Update button at the bottom.
Now click on New in the Action operations block. Let's configure the simple things first. Click on Add in the Send to Users section in the Operation details block, and click on Admin in the resulting popup. With the first operation updated, let's model the last few steps again:
|
Step |
Operation |
Interval (seconds) |
Time passed |
|---|---|---|---|
|
... |
... |
... |
... |
|
5 |
Send message to user |
Operation, 60 |
4 minutes |
|
6 |
none |
Default, 300 |
5 minutes |
|
7 |
none |
Default, 300 |
10 minutes |
|
8 |
none |
Default, 300 |
15 minutes |
With the latest modifications, it looks like we can send a message after 10 minutes have passed—that would be step 7. But we actually removed message sending on step 6, at 5 minutes. The good news—if we now add another operation to start at step 6, that finishes the first five-minute sending cycle and then keeps on sending a message every 5 minutes—just perfect.
Enter 6 in the first Steps field. We want this operation to continue until the problem is resolved, thus 0 goes in the second Steps fields. When done, click on the Add control at the bottom of the Operation details block.
We can see that Zabbix helpfully calculated the time when the second operation should start, which allows us to quickly spot errors in our calculations. There are no errors here; the second operation starts at 5 minutes as desired:

With that covered, our lower-level manager, advanced_user, must be notified after five minutes, but only once. That means another operation—click on New in the Action operations block. Click on Add in the Send to Users section and in the popup, click on advanced_user in the ALIAS column. The single message should be simple—we know that step 6 happens after five minutes have passed, so let's enter 6 in both Steps fields, then click on Add at the bottom of the Operation details block. Again, the START IN column shows that this step will be executed after five minutes, as expected.
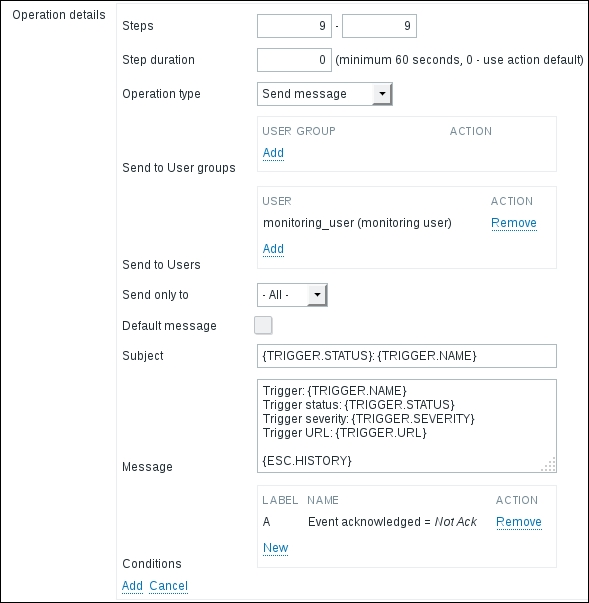
We are now left with the final task—notifying the higher-level manager after 20 minutes, and only if the problem has not been acknowledged. As before, click on New in the Action operations block, then click on Add in the Send to Users section, and in the popup, click on monitoring_user in the ALIAS column. Let's continue with our planned step table:
|
Step |
Operation |
Interval (seconds) |
Time passed |
|---|---|---|---|
|
... |
... |
... |
... |
|
7 |
none |
Default, 300 |
10 minutes |
|
8 |
none |
Default, 300 |
15 minutes |
|
9 |
none |
Default, 300 |
20 minutes |
As steps just continue with the default period, this shows us that step 9 is the correct one. As we want only a single notification here, enter 9 in both of the Steps fields.
An additional requirement was to notify this user only if the problem has not been acknowledged. To add such a restriction, click on New in the Conditions area. The Operation condition block is displayed, and the default setting already has Not Ack chosen, so click on Add in the Operation condition block. The form layout can be a bit confusing here, so make sure not to click on Add in the Operation details block instead. While we're almost done, there's one more bit we can do to make this notification less confusing for upper management. Currently, everybody receives the same message—some trigger information and the last values of items that are being referenced in triggers. Item values might not be that interesting to the manager, thus we can try omitting them from those messages. Untick the Default message checkbox and notice how we can customize subject and message for a specific operation. For the message, remove everything that goes below the Trigger URL line. For the manager, it might also be useful to know who was notified and when. Luckily, there's another helpful macro, {ESC.HISTORY}. Let's modify the message by adding an empty line and then this macro. Here's what the final result for this operation should look like:
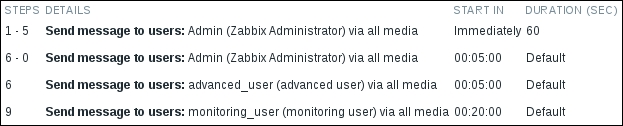
It's all fine, so click on Add at the bottom of the Operation details block. We can now review action operations and verify that each operation starts when it should:

Everything seems to match the specification. Let's switch back to the Action tab and, similar to the SNMP action, change the Recovery subject to Resolved: {TRIGGER.NAME}. This time we wanted to avoid Resolved: OK:, opting for a single mention that everything is good now. We can finally click on Update. With this notification setup in place, let's break something. On Another host, execute:
$ rm /tmp/testfile
It will take a short time for Zabbix to notice this problem and fire away the first e-mail to the Admin user. This e-mail won't be that different from the ones we received before. But now let's be patient and wait for 20 minutes more. During this time, the Admin user will receive more messages. What we are really interested in is the message content in the e-mail to the monitoring_user. Once you receive this message, look at what it contains:
Trigger: Testfile is missing
Trigger status: PROBLEM
Trigger severity: Warning
Trigger URL:

Problem started: 2016.04.15 15:05:25 Age: 20m
1. 2016.04.15 15:05:27 message sent        Email [email protected] "Zabbix Administrator (Admin)"
2. 2016.04.15 15:06:27 message sent        Email [email protected] "Zabbix Administrator (Admin)"
3. 2016.04.15 15:07:27 message sent        Email [email protected] "Zabbix Administrator (Admin)"
4. 2016.04.15 15:08:27 message sent        Email [email protected] "Zabbix Administrator (Admin)"
5. 2016.04.15 15:09:27 message sent        Email [email protected] "Zabbix Administrator (Admin)"
6. 2016.04.15 15:10:27 message failed        "advanced user (advanced_user)" No media defined for user "advanced user (advanced_user)"
6. 2016.04.15 15:10:27 message sent        Email [email protected] "Zabbix Administrator (Admin)"
7. 2016.04.15 15:15:28 message sent        Email [email protected] "Zabbix Administrator (Admin)"
8. 2016.04.15 15:20:28 message sent        Email [email protected] "Zabbix Administrator (Admin)"
It now contains a lot more information than just what happened—the manager has also received a detailed list of who was notified of the problem. The user Admin has received many notifications, and then... hey, advanced_user has not received the notification because their e-mail address is not configured. There's some work to do either for this user, or for the Zabbix administrators to fix this issue. And in this case, the issue is escalated to the monitoring_user only if nobody has acknowledged the problem before, which means nobody has even looked into it.
Tip
The current setup would cancel escalation to the management user if the problem is acknowledged. We may create a delayed escalation by adding yet another operation that sends a message to the management user at some later step, but does so without an acknowledgement condition. If the problem is acknowledged, the first operation to the management user would be skipped, but the second one would always work. If the problem is not acknowledged at all, the management user would get two notifications.
If we look carefully at the prefixed numbers, they are not sequential numbers of entries in the history, they are actually the escalation step numbers. That gives us a quick overview of which notifications happened at the same time, without comparing timestamps. The Email string is the name of the media type used for this notification.
Let's fix the problem now; on Another host execute:
$ touch /tmp/testfile
In a short while, two e-mail messages should be sent—one to the Admin user and one to monitoring_user. As these are recovery messages, they will both have our custom subject:
Resolved: Testfile is missing
Our test action had escalation thresholds that are too short for most real-life situations. If reducing these meant creating an action from scratch, that would be very inconvenient. Let's see how easily we can adapt the existing one. In the frontend, navigate to Configuration | Actions, then click on Test action in the NAME column and switch to the Operations tab. We might want to make the following changes, assuming that this is not a critical problem and does not warrant a quick response—unless it has been there for half an hour:
- Increase the interval between the further repeated messages the
Adminuser gets - Increase the delay before the messages to the
advanced_userandmonitoring_userare sent - Start sending messages to the
Adminuser after the problem has been there for 30 minutes
Let's start by changing the Default operation step duration to 1800 (30 minutes). Then let's click on Edit in the ACTION column next to the first entry (currently spanning steps 1-5). In its properties, set the Steps fields to 2 and 6, then click on the Update control in the Operation details block.
For both operations that start at step 6, change that to step 7. For the operation that has 6 in both of the Steps fields, change both occurrences the same way as before—and again, be careful not to click on the Update button yet.
The final result here should look like this:

If it does, click on that Update button.
The first change for the default operation step spaced all steps out—except the ones that were overridden in the operation properties. That mostly achieved our goals to space out notifications to the Admin user and delay notifications to the two other users. By changing the first step in the first operation from 1 to 2, we achieved two goals. The interval between steps 1 and 2 went back to the default interval for the action (as we excluded step 1 from the operation that did the overriding with 60 seconds), and no message was sent to the Admin user right away. Additionally, we moved the end step a bit further so that the total number of messages the Admin user would get with 1-minute intervals would not change. That resulted in some further operations not being so nicely aligned to the 5-minute boundary, so we moved them to step 7. Let's compare this to the previous configuration:
|
Before |
After |
|---|---|
|

|
This allows us to easily scale notifications and escalations up from a testing configuration to something more appropriate to the actual situation, as well as adapting quickly to changing requirements. Let's create another problem. On Another host, execute:
$ rm /tmp/testfile
Wait for the trigger to fire and for a couple of e-mails arrive for the Admin user, then "solve" the problem:
$ touch /tmp/testfile
That should send a recovery e-mail to the Admin user soon. Hey, wait—why for that user only? Zabbix only sends recovery notifications to users who have received problem notifications. As the problem did not get escalated for the management user to receive the notification, that user was not informed about resolving the problem either. A similar thing actually happened with advanced_user, who did not have media assigned. As the notification was not sent when the event was escalated (because no e-mail address was configured), Zabbix did not even try to send a recovery message to that user. No matter how many problem messages were sent to a user, only a single recovery message will be sent per action.
So in this case, if the Admin user resolved or acknowledged the issue before monitoring_user received an e-mail about the problem, monitoring_user would receive neither the message about the problem, nor the one about resolving it.
As we can see, escalations are fairly flexible and allow you to combine many operations when responding to an event. We could imagine one fairly long and complex escalation sequence of a web server going down to proceed like this:
- E-mail administrator
- Send SMS to admin
- Open report at helpdesk system
- E-mail management
- Send SMS to management
- Restart Apache
- Reboot the server
- Power cycle the whole server room
Well, the last one might be a bit over the top, but we can indeed construct a fine-grained stepping up of reactions and notifications about problems.
Did that escalation thing seem terribly complicated to you? If so, we can try an analogy that was coined near Salt Lake City.
Imagine there's a runner running through a forest, with a straight route. On this route, there are posts. The runner has a preferred speed (we might call it a default speed), which means that it normally takes T seconds for the runner to go from one post to the next one.
On the posts, there may be instructions. The runner starts from the very first post, and checks for instructions there. Instructions can order the runner to do various things:
- Send SMS to somebody at this post only
- Send SMS to somebody from this post until post
N - Change speed from this post until the next post to arrive sooner or later
- Change speed from this post until post
N
The route is taken by the runner no matter what—if there are no instructions at the current post, the runner just continues to the next post.
If this analogy made how the action escalation steps are processed by the "runner" clearer, it might be worth reviewing this section and possibly gaining better understanding of the details, too.
While Zabbix supports a decent range of notification mechanisms, there always comes a time when you need something very specific and the default methods just don't cut it. For such situations, Zabbix supports custom scripts to be used as media. Let's try to set one up. Open Administration | Media types and click on Create media type. Enter these values:
- Name:
Test script - Type: Script
- Script name:
testscript - Script parameters: Click on the Add control and enter
{ALERT.MESSAGE}in the new field:

Tip
The {ALERT.MESSAGE} macro will be expanded to the message body from the action configuration. Currently, two additional macros are supported in the script parameters—{ALERT.SENDTO} and {ALERT.SUBJECT}. Consult the Zabbix manual to check whether any new macros are added in later versions at https://www.zabbix.com/documentation/3.0/manual/config/notifications/media/script.
When you are done, click on the Add button at the bottom. Now we should make sure this media is used at some point. Go to Administration | Users, click on monitoring_user in the ALIAS column, and switch to the Media tab. Click on Add in the Media section. In the Type dropdown, select Test script and in the Send to field, enter [email protected]:
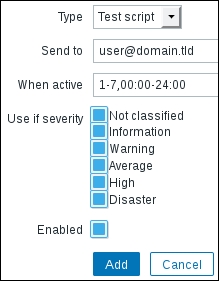
When you are done, click on Add and confirm the changes by clicking on Update in the user editing form. Before we continue with the script itself, navigate to Configuration | Actions and click on Disabled next to SNMP action to enable this action.
We entered the script name, but where should the script be placed? Now is the time to return to where we haven't been for some time—take a look at zabbix_server.conf and check what value the AlertScriptsPath option has. The default location will vary depending on the method of installation. If you installed from source, it will be /usr/local/share/zabbix/alertscripts. Distribution packages are likely to use some other directory. As root, create a file called testscript in that directory:
# touch /path/to/testscript
# chmod 755 /path/to/testscript
Populate it with the following content:
#!/bin/bash
for i in "$@"; do
    echo "$i" >> /tmp/zabbix_script_received.log
done
As you can see, we are simply logging each passed parameter to a file for examination. Now generate SNMP traps so that the snmptraps trigger switches to the PROBLEM state. Wait for the e-mail to arrive, then check the /tmp/zabbix_script_received.log file. It should have content similar to this:
Trigger: SNMP trap has arrived on snmptraps
Trigger status: PROBLEM
Trigger severity: Information
Trigger URL:

Item values:

1. Received SNMP traps (snmptraps:snmptraps): 192.168.56.11 "Critical Error"   NET-SNMP-MIB::netSnmpExperimental
2. *UNKNOWN* (*UNKNOWN*:*UNKNOWN*): *UNKNOWN*
3. *UNKNOWN* (*UNKNOWN*:*UNKNOWN*): *UNKNOWN*

Original event ID: 397
We can see that the whole message body from action properties is passed here with newlines intact. If we wanted to also know the user media Send to value to identify the Zabbix user who received this data, we would also pass the {ALERT.SENDTO} macro to our alertscript. Similarly, to get the subject from the action properties, we would use the {ALERT.SUBJECT} macro.
From here, basically anything can be done with the data: passing it to issue management systems that do not have an e-mail gateway, sending it through some media not supported directly by Zabbix, or displaying it somewhere.
Let's revisit action configuration now—open Configuration | Actions and click on Test action in the NAME column. Now we have a script executed whenever monitoring_user receives a notification. But what if we would like to skip the script for notification, and only use it in a specific action? Thankfully, we don't have to create a separate user just for such a scenario. Switch to the Operations tab and in the Action operations block, click on Edit next to the last operation—sending a message to monitoring_user. Take a look at the dropdown Send only to. It lists all media types, and allows us to restrict a specific operation to a specific media type only. In this dropdown, choose Email. Click on the Update link at the bottom of the Operation details block, then the Update button at the bottom.
By using the Send only to option, it is possible to use different notification methods for different situations without creating multiple fake user accounts. For example, a user might receive e-mail for the first few escalation steps, then an SMS would be sent.
Sending out messages to technicians or the helpdesk is nice, but there are times and conditions when it is desirable to automatically open an issue in some management system. This is most easily achieved by using two main integration methods:
- E-mail gateways
- APIs that decent systems provide
To implement such an integration, the following steps should be taken:
- Create a Zabbix user for the ticketing system notifications.
- Configure media for this user (the e-mail address that the system receives e-mail at, or the script to run).
- Assign read-only access for resources tickets should be automatically created for (remember, no alerts are sent or scripts run if the user does not have access to any of the hosts involved in the event generation).
- Create a separate action, or add this user as a recipient to an existing action operation with a custom message (by unmarking the Default message checkbox when editing the operation).
There's also a step 5—either proper message contents should be formatted so that the receiving system knows what to do with the message, or a script created to access the ticketing system API. This is specific to each system, but let's look at a few examples. These examples provide only basic information—for added bonus points you can add other macros such as last or average value ones. Note that the specific syntax might change between ticketing system versions, so check the documentation for the version you are using.
Bugzilla is famous free bug tracker, sometimes abused as a general issue management system. Still, Zabbix can monitor the status of software tests and open new tickets if, for example, compilation fails. The following would be configured as the message body:
@{TRIGGER.NAME}
@product = <some existing product>
@component = <some existing component>
@version = 1.8
{DATE} - {TIME}
{TRIGGER.NAME}.
The From address is used to determine the user account that is creating the bug report.
CA Service Desk Manager (formerly Unicenter Service Desk), from Computer Associates, is a solution that provides a ticketing system, among other features. The following would be configured as the message body:
"start-request"
%CUSTOMER= <some existing user account>
%DESCRIPTION= {DATE} - {TIME}
{TRIGGER.NAME}.
%SUMMARY= {TRIGGER.NAME}.
%PRIORITY= {TRIGGER.NSEVERITY}
%CATEGORY= <some existing category>
"end-request"Atlassian JIRA is a popular ticketing system or issue tracker. While it also supports an e-mail gateway for creating issues, we could look at a more advanced way to do that—using the API JIRA exposes. Media type and user media would have to be created and configured, similar to what we did in the Using scripts as media section earlier in this chapter, although it is suggested to create a special user for running such scripts.
As for the script itself, something like this would simply create issues with an identical summary, placing the message body from the action configuration in the issue summary:
#!/bin/bash
json='{"fields":{"project":{"key":"PROJ"},"summary":"Issue automatically created by Zabbix","description":"'"$1"'","issuetype":{"name":"Bug"}}}'
curl -u username:password -X POST --data "$json" -H "Content-Type: application/json" https://jira.company.tld/rest/api/2/issue/
For this to work, make sure to replace the project key, username, password, and URL to the JIRA instance—and possibly also the issue type.
This could be extended in various ways. For example, we could pass the subject from the action properties as the first parameter, and encode the trigger severity among other pipe-delimited things. Our script would then parse out the trigger severity and set the JIRA priority accordingly. That would be quite specific for each implementation, though—hopefully this example provided a good starting point.
The script media type is quite powerful, and it could even be used to execute a command in response to an event. For the command to be executed on the monitored host, though, it would require some mechanism to connect, authorize, and such like, which might be somewhat too complicated. Zabbix provides another mechanism to respond to events—remote commands. Remote commands can be used in a variety of cases, some of which might be initiating a configuration backup when a configuration change is detected, or starting a service that has died. We will set up the latter scenario.
Navigate to Configuration | Actions, click on Create action. In the Name field, enter Restart Apache. Switch to the Conditions tab and in the New condition block choose Host in the first dropdown and start typing another. In the dropdown that appears, click on Another host. Click on Add control (but do not click on the Add button yet).
Let's create another condition—in the New condition block, in the first dropdown, choose Trigger name. Leave the second dropdown at the default value. In the input field next to this, enter Web service is down, then click on Add control. The end result should look as follows:

Now switch to the Operations tab. In the Action operations block, click on New. In the Operation details block that just appeared, choose Remote command in the Operation type field. Zabbix offers five different types of remote command:
- Custom script
- IPMI
- SSH
- Telnet
- Global script
We will discuss SSH and telnet items in Chapter 10, Advanced Item Monitoring. We will discuss IPMI functionality in Chapter 13, Monitoring IPMI Devices. Global scripts will be covered later in this chapter—and right now let's look at the custom script functionality.
For custom scripts, one may choose to run them either on the Zabbix agent or the Zabbix server. Running on the agent will allow us to gather information, control services, and do other tasks on the system where problem conditions were found. Running on the server will allow us to probe the system from the Zabbix server's perspective, or maybe access the Zabbix API and take further decisions based on that information.
For now, we will create an action that will try to restart the Apache webserver if it is down. Normally, that has to be done on the host that had the problem. In the Target list section, click on the New link. The dropdown there will have Current host selected, which is exactly what we wanted, so click on the Add control just below it.
In the Commands textbox, enter the following:
sudo /etc/init.d/apache2 restart
Note
This step and the steps that come later assume the existence and usability of the /etc/init.d/apache2 init script. If your distribution has a different control script, use the path to it instead. If your distribution uses systemd exclusively, you will probably have to use a command such as /usr/bin/systemctl restart apache2 or /usr/bin/systemctl restart httpd.service. Note that the name of the service can be different, too.
We are restarting Apache just in case it has stopped responding, instead of simply dying. You can also enter many remote actions to be performed, but we won't do that now, so just click on the Add control at the bottom of the Operation details block. To save our new action, click on the Add button at the bottom.
Our remote command is almost ready to run, except on the agent side there's still some work to be done, so open zabbix_agentd.conf as root and look for the EnableRemoteCommands parameter. Set it to 1 and uncomment it, save the config file, and restart zabbix_agentd.
That's still not all. As remote commands are passed to the Zabbix agent daemon, which is running as a zabbix user, we also have to allow this user to actually restart Apache. As evidenced by the remote command, we will use sudo for this, so edit /etc/sudoers on Another host as root and add the following line:
zabbix ALL=NOPASSWD: /etc/init.d/apache2 restart
Again, change the script name if you need a different one. This allows the zabbix user to use sudo and restart the Apache web server—just restart it, don't stop or do any other operations.
Now we are ready for the show. Stop the web server on Another host. Wait for the trigger to update its state and check the web server's status. It should start again automatically.
Tip
By default, all actions get two conditions. One of them limits the action to fire only when the trigger goes into the PROBLEM state, but not when it comes back to the OK state. For this action, it is a very helpful setting; otherwise the webserver would be restarted once when it was found to be down, and then restarted again when it was found to be up. Such a configuration mistake would not be obvious, so it might stay undetected for a while. One should also avoid enabling recovery messages for an action that restarts a service.
Note that remote commands on agents only work with passive agents—they will not work in active mode. This does not mean that you cannot use active items on such a host—you may do this, but remote commands will always be attempted in passive mode by the server connected directly to that agent. There might be a situation where all items are active and thus a change in configuration that prevents server-to-agent connection from working is not noticed—and then the remote command fails to work. If you have all items active and want to use remote commands, it might be worth having a single passive item to check whether that type of item still works.
While the need to restart services like this indicates a problem that would be best fixed for the service itself, sometimes it can work as an emergency solution, or in the case of an unresponsive proprietary software vendor.