
LLD is concerned with discovering entities on an individual host. Zabbix also supports a way to scan a network address range and perform some operation based on what has been discovered there—that's called network discovery.
To see how this could work, let's have a simple discovery rule. We can discover our test systems, or we can point the discovery at some other network range that is accessible to the Zabbix server.
To create a network discovery rule, navigate to Configuration | Discovery and click on Create discovery rule. Fill in the name and IP range as desired, and then click on New in the Checks block. Choose ICMP ping in the Check type dropdown, and click on Add in this block. Additionally, change Delay to 120 so that we can more easily see the effects of any changes:
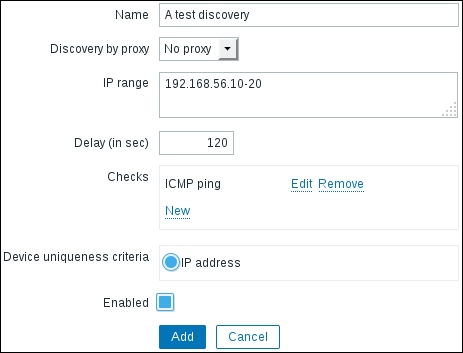
Tip
Make sure fping is properly configured—we did that in Chapter 3, Monitoring with Zabbix Agents and Basic Protocols.
After a few minutes have passed, check the Monitoring | Discovery section:
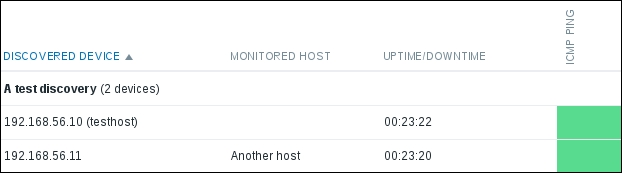
All the devices that respond to the ping in the configured range will be listed here. If a device is already monitored as a host in Zabbix, it will be listed in the MONITORED HOST column. We will also see for how long the host is known to be up, and the ICMP PING column will list this specific service in green for all hosts. But why is only one host listed as already monitored here? Hosts are recognized here by their IP addresses, and for A test host, we used 127.0.0.1. The address by which it was discovered differs, so it's not really considered to be the same host or device.
Now, navigate back to Configuration | Discovery and click on A test discovery in the NAME column. Click on New in the Checks block and choose a service that is accessible and would be easy to control on these hosts—perhaps SMTP again. Click on Add in the Checks section, and then click on New there again. This time, choose a service that is not present on any host in the configured range—FTP might be a good choice. Then, click on Add in this block again:
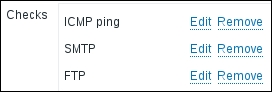
Finally, click on Update. After a couple of minutes, visit Monitoring | Discovery:
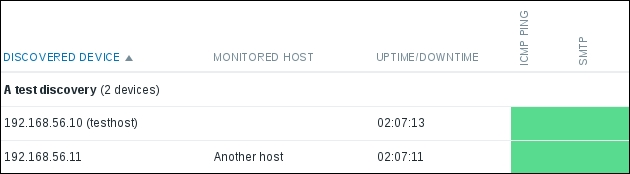
SMTP has appeared, which is great. But why is there no FTP column? Could this view be limited to two services? It's not limited to a specific number of services, but a service that is not discovered on any of the hosts does not show up at all at this time. If a service were initially discovered on some systems but not on others, the column would be shown and the systems where the service was not discovered would get a Grey cell.
If we move the cursor over the green cells, we will be able to see for how long this service has been up (or discovered):
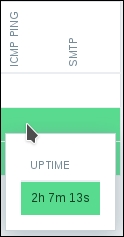
Let's break something now—bring down the SMTP service on one of the hosts, and wait for a couple of minutes. The SMTP cell for that host should turn red, and the popup should start tracking downtime for that service now. If all services on a host went down, the host itself would be considered as down, and that would be reflected in the UPTIME/DOWNTIME column.
The discovery monitoring page is interesting at first but not that useful in the long term. Luckily, we can make Zabbix perform operations in response, and the configuration is somewhat similar to how we reacted to triggers firing. To see how this is configured, navigate to Configuration | Actions, and switch to Discovery in the Event source dropdown in the upper-right corner. Then, click on Create action. One thing to notice right away is that this action still has the default subject and message filled in, but the contents are different: the macros used here are specific to network discovery. Fill in the name of Network discovery test, and let's switch to the Conditions tab and expand the first dropdown in the New condition section:
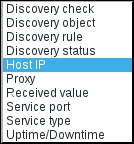
The available conditions are completely different from what was available for trigger actions. Let's review them:
- Discovery check: A specific check in a specific discovery rule must be chosen here.
- Discovery object: Either a device or service can be chosen here. In our example, the discovered host would be a device object and SMTP would be a service object.
- Discovery rule: A specific network discovery rule must be chosen here.
- Discovery status: This condition has possible values of Up, Down, Discovered, and Lost. For devices, they are considered to be discovered or up if at least one service on them can be reached. Here is what the values mean:
- Discovered: This device or service is being seen for the first time or after it was detected to be down
- Lost: This device or service has been seen before, but it has just disappeared
- Up: The device or service has been discovered—no matter how many times it might have happened already
- Down: The device or service has been discovered at some point, but right now, it is not reachable—no matter how many times that has happened already
- Host IP: Individual addresses or ranges may be specified here.
- Proxy: Action may be limited to a specific Zabbix proxy. We will discuss proxies in Chapter 19, Using Proxies to Monitor Remote Locations.
- Received value: If we are polling a Zabbix agent item or an SNMP OID, we may react to a specific value—for example, if discovering by the
system.unameitem key, we could link all hosts that haveLinuxin the returned string to the Linux template. - Service port: Action may be limited to a specific port or port range on which the discovery has happened.
- Service type: Action may be restricted to a service type. This is similar to the Discovery check condition, except that choosing SMTP here would match all SMTP checks from all network discovery rules, not just a specific one.
- Uptime/Downtime: Time in seconds may be entered here to limit the action only after the device or service has been up or down for some period of time.
Most of these are pretty self-explanatory, but let's take a closer look at two of them. The Discovery status condition allows us to differentiate between the initial check or being discovered after downtime and periodic checks. As an example, if we matched the Up status and added the host to a Host group, this addition would be checked and performed every time the host can be reached. If somebody removed that host from that host group, it would be re-added during every discovery cycle. If we matched the Discovered status, it would only happen when the host is first discovered and when it goes down and then up again. Automatic re-adding to the group is most likely to happen later in this case.
The Uptime/Downtime condition allows us to react with some delay, not immediately. For example, we might want to have an uptime of a few hours before monitoring some device as it might be a temporary troubleshooting laptop that is attached to the network. Probably even more importantly, we might not want to delete a host with all its history if that host is down for 5 minutes. Checking for a week-long downtime might be reasonable—if nobody bothered with that host for a week, it's safe to delete.
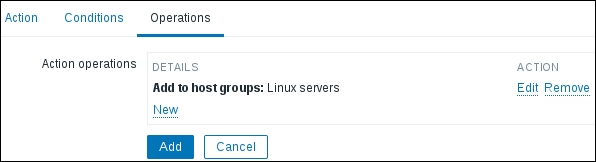
For now, let's leave the conditions empty and switch to the Operations tab. Adding a new operation and expanding the Operation type dropdown will reveal all the available operations. We will discuss them in more detail a bit later, but for now, let's choose Add to host groups. In the input field, start typing linux, and choose Linux servers from the dropdown. Then, click on the small Add control in the Operation details block. Be very careful here, as it is easy to lose some configuration. When done, click on the Add button at the bottom:
After a couple of minutes, go to Configuration | Hosts to observe the results. If discovering our test systems, we should see one new host added.
Why only one host? The other host already existed as per Monitoring | Discovery earlier. For this host, you will see either its hostname or the IP address used as the hostname in Zabbix. If the Zabbix server was able to perform a reverse lookup on the IP address, the result will be used as the hostname. If not, the IP address will be used as the hostname.
Click on New host in the NAME column. In the Groups section, this host is in the Linux servers group, as expected. But it is also in some other group, Discovered hosts. Where did that come from?
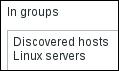
By default, all hosts discovered by network discovery are added to a specific group. Which group? That's a global setting. Navigate to Administration | General, then choose Other in the dropdown. The Group for discovered hosts setting allows us to choose which group that is. What if you don't want the discovered hosts to end up in that group? In the action operations, we could add another operation, Remove from host group, and specify the Discovered hosts group.
Let's review all available discovery operations now:
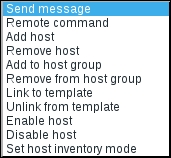
- Send message: The same as for trigger actions, we may send a message to users and user groups. This could be used both to supplement an action that adds devices ("Hey, take a look at this new server we just started monitoring") or as a simple notification that a new device has appeared on the network ("This new IP started responding, but I won't automatically monitor it").
- Remote command: Zabbix can attempt to run a remote command on a passive Zabbix agent or Zabbix server, a command using IPMI, SSH, or Telnet, and even a global script. This would only succeed if remote commands are enabled on the Zabbix agent side. We discussed remote commands in Chapter 7, Acting upon Monitored Conditions.
- Add host: A host will be added and only included in the Discovered hosts group.
- Remove host: A host will be removed. This probably makes most sense to perform when a host has not been discovered, and to be safe, only do so when the downtime exceeds some period of time.
- Add to host group: A host will be added to a host group. If there is no such host, one will be added first.
- Remove from host group: A host will be removed from a host group.
- Link to template: A host will be linked to a template. If there is no such host, one will be added first.
- Unlink from template: A host will be unlinked from a template.
- Enable host: A host will be enabled. If there is no such host, one will be added first.
- Disable host: A host will be disabled. This could be used as a safer alternative to removing hosts, or we could disable a host first and remove it later. If there is no such host, one will be added first.
When linking to a template, the host still needs all the proper interfaces as required by the items in that template. During discovery, only successful discovery checks result in the adding of interfaces of a corresponding type. For example, if we only found SNMP on a host, only an SNMP interface would be added. If both SNMP and Zabbix agent discovery checks succeeded on a host, both interfaces would be added. If some checks succeed later, additional interfaces are created.
But what about multi-homed hosts that have multiple interfaces exposed to Zabbix network discovery? Let's return to Configuration | Discovery and click on A test discovery. Look at the Device uniqueness criteria option—the only setting there is IP address. In the Checks block, click on New and choose Zabbix agent in the Check type dropdown. In the Key field, enter system.uname, and then click on Add in the Checks block. Notice how the Device uniqueness criteria got a new option—Zabbix agent "system.uname":
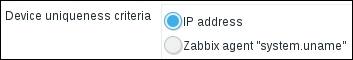
By default, with the uniqueness criteria set to IP address, Zabbix will create a new host for each discovered IP address. If there's a system with multiple addresses, a new host will be created for each address. If the uniqueness criteria is set to a Zabbix agent item, it will look at all the IP addresses it has seen before and the values it got back for that item key. If the new value matches some previous value, it will add a new interface to the existing host instead of creating a new host. It works the same way with SNMP—adding an SNMP check will add another uniqueness criteria option, and Zabbix will compare values received for that specific OID. It is common to discover SNMP devices by the SNMPv2-MIB::sysDescr.0 OID.
Now that we have discussed network discovery, I'll give you one short suggestion about it—don't use it. Well, maybe not that harsh, but do not cling to it too much. There are use cases for network discovery, but quite often, there's a decent list of devices that should be monitored coming either from a configuration management database (CMDB) or some other source. In that case, it is better to integrate and automatically update your Zabbix configuration based on that authoritative source. If your answer to "What's your most definitive list of hosts in your environment?" is "Zabbix", then network discovery is for you.