 Visualizing the date through a slide show
by Andrea Vacche, Patrik Uytterhoeven, Rihards Olups
Zabbix: Enterprise Network Monitoring Made Easy
Visualizing the date through a slide show
by Andrea Vacche, Patrik Uytterhoeven, Rihards Olups
Zabbix: Enterprise Network Monitoring Made Easy
- Zabbix: Enterprise Network Monitoring Made Easy
- Table of Contents
- Zabbix: Enterprise Network Monitoring Made Easy
- Zabbix: Enterprise Network Monitoring Made Easy
- Credits
- Preface
- I. Module 1
- 1. Getting Started with Zabbix
- The first steps in monitoring
- Zabbix features and architecture
- Installation
- Summary
- 2. Getting Your First Notification
- 3. Monitoring with Zabbix Agents and Basic Protocols
- 4. Monitoring SNMP Devices
- 5. Managing Hosts, Users, and Permissions
- 6. Detecting Problems with Triggers
- 7. Acting upon Monitored Conditions
- 8. Simplifying Complex Configurations with Templates
- 9. Visualizing Data with Graphs and Maps
- 10. Visualizing Data with Screens and Slideshows
- 11. Advanced Item Monitoring
- 12. Automating Configuration
- 13. Monitoring Web Pages
- 14. Monitoring Windows
- 15. High-Level Business Service Monitoring
- 16. Monitoring IPMI Devices
- 17. Monitoring Java Applications
- 18. Monitoring VMware
- 19. Using Proxies to Monitor Remote Locations
- 20. Encrypting Zabbix Traffic
- 21. Working Closely with Data
- 22. Zabbix Maintenance
- A. Troubleshooting
- B. Being Part of the Community
- 1. Getting Started with Zabbix
- II. Module 2
- 1. Zabbix Configuration
- 2. Getting Around in Zabbix
- 3. Groups, Users, and Permissions
- 4. Monitoring with Zabbix
- Introduction
- Active agents
- Passive agents
- Extending agents
- SNMP checks
- Internal checks
- Zabbix trapper
- IPMI checks
- JMX checks
- Aggregate checks
- External checks
- Database monitoring
- Checks with SSH
- Checks with Telnet
- Calculated checks
- Building web scenarios
- Monitoring web scenarios
- Some advanced monitoring tricks
- Autoinventory
- 5. Testing with Triggers in Zabbix
- 6. Working with Templates
- 7. Data Visualization and Reporting in Zabbix
- 8. Monitoring VMware and Proxies
- 9. Autodiscovery
- 10. Zabbix Maintenance and API
- C. Upgrading and Troubleshooting Zabbix
- III. Module 3
- 1. Deploying Zabbix
- 2. Distributed Monitoring
- 3. High Availability and Failover
- Understanding high availability
- Understanding the levels of IT service
- Some considerations about high availability
- Implementing high availability on a web server
- Configuring the Zabbix server for high availability
- Implementing high availability for a database
- Summary
- 4. Collecting Data
- 5. Visualizing Data
- 6. Managing Alerts
- 7. Managing Templates
- 8. Handling External Scripts
- 9. Extending Zabbix
- 10. Integrating Zabbix
- D. Bibliography
- Index
Once you have created all your screens, you can provide a slide show to your helpdesk that implements a screen rotation.
Creating a slide show is easy; go to Configuration | Slide shows | Create slide show. A window, as shown in the following screenshot, will appear:
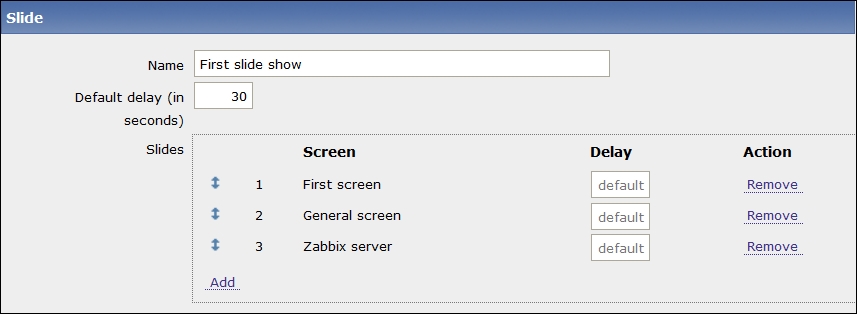
You can see the slide show configuration in the preceding screenshot. This configuration screen is really intuitive; Name identifies the name of your slide show, and in Default delay (in seconds), you need to specify the default delay that will be applied to all the screens in the slide show.
In the Slides section—enumerated in the preceding screenshot to have a visualization order—you can specify a different delay for each one of them. Basically, you can customize how long each screen will be displayed. Once saved, your slide show will be available to be displayed upon navigating to Monitoring | Screens, and then you can choose in the Slide shows drop-down menu on the right-hand side after your slide show name.
Tip
In the slide show, you can only create a screen rotation. So, to add a single element, such as a graph or a map, on your rotation, you need to create a screen that contains your elements to be displayed. Using this method, you can basically add all that can be represented on a screen on the slide show.
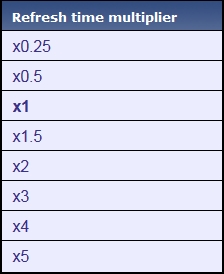
If you want to speed up or slow down your slide show, you can change the refresh multiplier that will appear by clicking on the Menu icon (on the right-hand side of the listbox), which will return a window, as shown in the following screenshot:
-
No Comment