
The best way to learn about a feature is to use it. We don't have any business services in our environment, thus we could use a similar approach as with the network map link indicator feature, where we created "fake" items and triggers to simulate network issues. We'll create items and triggers that will act as high-level service monitors.
We will invent two companies, called "Banana" and "Pineapple". Our company would be hosting various services for these two companies:
- A code repository system for "Banana"
- A warehouse analytics system for "Pineapple"
- A ticketing system for "Banana" and "Pineapple"
Our service tree could look like this:
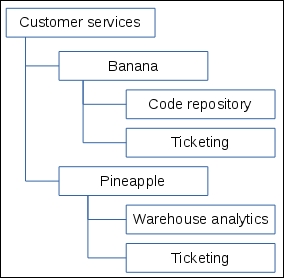
If everything is green at the top level, we know that all our customers are happy. If not, we see which customer is having an issue with a system, and we could see which system is affected. The ticketing system going down would affect both customers. And anything below these services—well, that's operational monitoring.
Unfortunately, IT services functionality is not that easy to evaluate without collecting data for a longer period of time; SLA graphs are more interesting when we have data for a few weeks or more. Maybe if we could send in data and pretend it's past data. Actually, we can do that. The small but great tool zabbix_sender, which we discussed in Chapter 11, Advanced Item Monitoring, allows us to specify a timestamp for each value. This means that we will create Zabbix trapper items and push values in those.
Proceed to Configuration | Hosts and click on Create host. Normally, items such as these would reside in different hosts, but for our test setup a single host will be best. Enter "IT services" in the Host name and New group fields and make sure no groups are in the In groups selectbox, then click on the Add button at the bottom. Switch to IT services in the Group drop-down, click on Items next to IT services, then click on Create item. This way, we create three different items with these settings:
- Name:
Code repository service - Type: Zabbix trapper
- Key:
code_repo - New application:
IT services
You can use the item cloning feature to create the remaining two items more rapidly. Use the Applications field instead of the New application field for the remaining items:
- Name:
Warehouse analytics service - Type: Zabbix trapper
- Key:
warehouse_analytics - Application: IT services
And for the last item:
- Name:
Ticketing service - Type: Zabbix trapper
- Key:
ticketing - Application: IT services
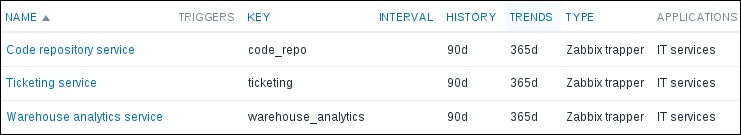
The final list of items should look like this:
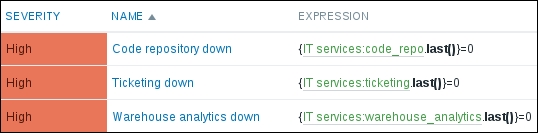
Now click on Triggers in the navigation bar above the item list, then click on Create trigger. Create three triggers with settings as follows. For the first trigger:
- Name:
Code repository down - Expression:
{IT services:code_repo.last()}=0 - Severity: High
For the second trigger:
- Name:
Warehouse analytics down - Expression:
{IT services:warehouse_analytics.last()}=0 - Severity: High
And for the third trigger:
- Name:
Ticketing down - Expression:
{IT services:ticketing.last()}=0 - Severity: High
In these triggers, the severity setting was very important. By default, triggers in Zabbix have the lowest severity, "Not classified". SLA calculation in IT services ignores the two lowest severities, "Not classified" and "Information". There does not seem to be a functional benefit from that, and the reasons are most likely historic. It is somewhat common for users to create quick testing triggers only to see that the SLA calculation does not work. When creating the trigger, the severity setting was not changed as a relatively unimportant one for a quick test. Luckily, we knew about it and created triggers that will work in the SLA calculation.
We are getting closer to sending in our slightly fake data, but we must configure IT services before the data comes in. In Zabbix, SLA results cannot be calculated retroactively. IT services must be configured at the beginning of the period for which we want to collect the SLA. SLA state is stored separately from trigger and event information and is calculated at runtime by the Zabbix server.
Let's go to Configuration | IT services. The interface for managing IT services is different from most other places in Zabbix. We have root, which is an immutable entry. All other service entries must be added as children to it. Click on Add child next to the root entry.
We will start by grouping all customer services in an entry—we might have internal services later. In the Name field, enter "Customer services" and click on the Add button at the bottom.
We have two customers—click on Add child next to Customer services. Enter "Banana" in the Name field, enable the Calculate SLA checkbox, then click on Add.
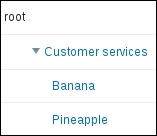
Click on Add child next to Customer services again. Enter "Pineapple" in the Name field, enable the Calculate SLA checkbox, then click on Add. Notice how the Customer services entry can be expanded now. Expand it and observe the result, which should be like this:
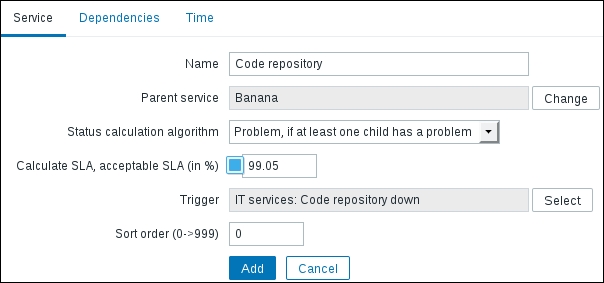
The customers are in place; let's add their services now. Click on Add child next to Banana. Enter "Code repository" in the Name field and enable the Calculate SLA checkbox. This will be our "leaf" or lower-level service, and we will now link it to a trigger. The trigger state will affect the SLA state for this service and for all upper-level services with SLA calculation enabled. Click on Select next to the Trigger field, then click on Code repository down in the NAME column. The final configuration for this service should look like this:
When done, click on Add. Then click on Add child next to Banana again. Enter "Ticketing" in the Name field, enable the Calculate SLA checkbox and click on Select next to the Trigger field, then click on Ticketing down in the NAME column. Click on the Add button to add the second child service for this customer.
Our first customer is configured; now click on Add child next to Pineapple. Enter "Warehouse analytics" in the Name field, enable the Calculate SLA checkbox, and click on Select next to the Trigger field. Click on Warehouse analytics down in the NAME column then click on the Add button.
We can add the ticketing service as another child service for "Pineapple", but services here can also be defined once, then added at multiple places in the service tree. This is done by making parent services depend on additional services. Click on Pineapple and switch to the Dependencies tab. Notice how its only child service, Warehouse analytics, is already listed here. Click on the Add link and click on Ticketing entry. Click on the Update button:

That didn't work well. If one is familiar with filesystem concepts, the error message might be a bit helpful; otherwise, it is probably a very confusing one. IT services in Zabbix have one "hard link"—they are attached to a parent service. To attach them to another service, we add them as a dependency, but we have to add them as a "soft link", as only one "hard link" is allowed per service. Mark the SOFT checkbox next to Ticketing and click on Update again. This time the operation should be successful and the Ticketing entry should now be visible for both companies.
If the entries are collapsed for you, expand them all and observe the final tree:
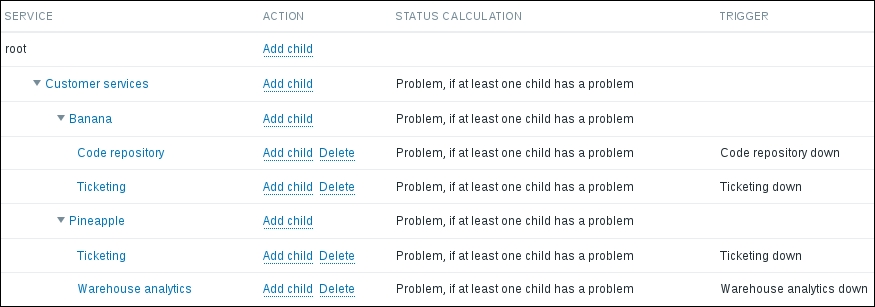
Note that we enabled SLA calculation starting from the company level. Computing total SLA across all customers is probably not a common need, although it could be done. In the STATUS CALCULATION column, all of our services have Problem, if at least one child has a problem. In the SERVICE properties, we could also choose Problem, if all children have problems. At this time, those are the only options for problem state propagation; setting the percentage or amount of child services is not possible (it could be useful for a cluster solution, for example).
Now is the time to send in our data, which will be a bit fake. As mentioned, IT services/SLA functionality is more interesting when we have data for a longer period of time, and we could try to send in data for a year. Of course, we won't create it manually—we will generate it. Create a script like this on the Zabbix server:
#!/bin/bash
hostname="IT services"
time_period=$[3600*24*365] # 365 days
interval=3600 # one hour
probability=100
current_time=$(date "+%s")
for item_key in code_repo warehouse_analytics ticketing; do
        [[ -f $item_key.txt ]] && {
                echo "file $item_key.txt already exists"
                exit
        }
        for ((value_timestamp=$current_time-$time_period; value_timestamp<$current_time; value_timestamp=value_timestamp+$interval)); do
                echo ""$hostname" $item_key $value_timestamp $([[ $(($RANDOM%$probability)) < 1 ]] && echo 0 || echo 1)" >> $item_key.txt
        done
done
This script will generate values for each of our three item keys every hour, for one year in the past, starting at the current time. For each entry, there is a small chance of getting a value of 0, which is failure. The result will be random, but it should fluctuate around our acceptable SLA level, so hopefully we will get some services that do meet the SLA level and some that do not. As all of the values are sent in with a one-hour interval and it is quite unlikely that two failures would follow one another, no downtime should be longer than one hour. Assuming the script was saved as generate_values.sh, you just have to run it once:
$ ./generate_values.sh
Three files should be generated:
code_repo.txtticketing.txtwarehouse_analytics.txt
Now run zabbix_sender for each of these files:
$ zabbix_sender -z 127.0.0.1 -T -i code_repo.txt
$ zabbix_sender -z 127.0.0.1 -T -i ticketing.txt
$ zabbix_sender -z 127.0.0.1 -T -i warehouse_analytics.txt
The output on each invocation should be similar to this:
info from server: "processed: 250; failed: 0; total: 250; seconds spent: 0.001747"
...
info from server: "processed: 10; failed: 0; total: 10; seconds spent: 0.000063"
sent: 8760; skipped: 0; total: 8760
Tip
Zabbix sender processes up to 250 values per connection—refer to Chapter 11, Advanced Item Monitoring, for more details about this small, but great, utility.
If all of the above succeeded, great; we now have a year's worth of data.