
The last graphical element that will be discussed in this chapter is a high-level view of our monitored infrastructure. In a business-level view, there is no provision for low-level details, such as CPU usage, memory consumption, and free space. What the business would like to see is the availability of your services provided and the service-level agreements of your IT services.
Zabbix covers this point with IT services. A service is a hierarchical view of your service. Now imagine that you need to monitor your website (we discussed SLAs in Chapter 1, Deploying Zabbix). You need to identify your service components, for example, web server, application server, and DB server. For each one of them, you need to identify triggers that tell you whether the service is available or not. The hierarchical view is the one represented in the following screenshot:
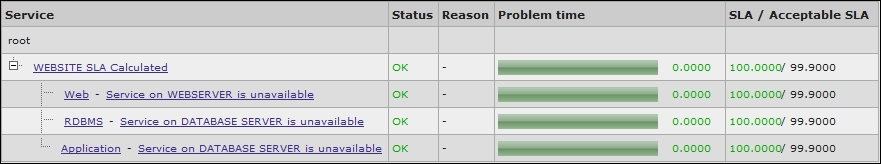
In this hierarchy, each node has a status; this status is calculated on the basis of triggers and propagated to the higher level with the selected algorithm. So, the lowest level of IT services is managed via triggers.
Triggers with the severities Information and Not classified are not considered and don't affect the SLA calculation.
The way to configure an IT service is by navigating to Configuration | IT services; you can create your service here. The following screenshot displays a service previously configured:
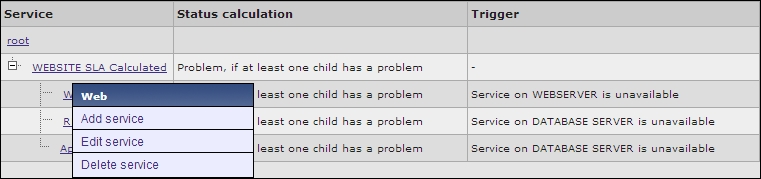
By clicking on a service, you can add a service, edit the current service, or delete it. The service configuration is composed of three forms: the first one describes the service, the second tab is dedicated to the dependencies, and the third is dedicated to the time.
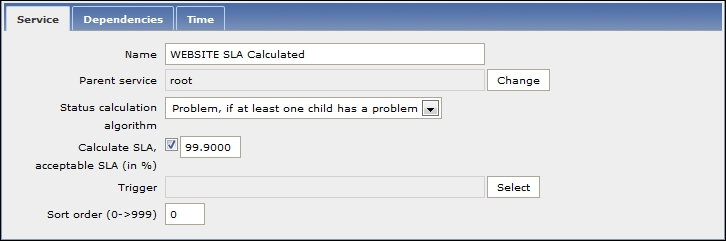
On the service tab, you need to define your own service name. In this particular example, the website SLA is calculated; of course, a website is composed of different components, such as the web server, application server, and a DBMS. In a three-level environment, they are usually on a dedicated server. Now, since all the three components are vital for our merchant website, we need to calculate the SLA propagating the problems. This means that if the child of our website has a problem, the whole website has a problem, and this will reflect in the SLA calculation.
Zabbix provides the following three options in the status calculation algorithm:
- Do not calculate: This option ignores the status calculation completely.
- Problem, if at least one child has a problem: This means that if each one of our three components has an issue, the service will be considered unavailable. This is the case when each one of the servers doesn't have a failover node.
- Problem, if all the children has a problem: To propagate the problem, all the children need to be affected by the problem. This case is typical for a clustered or load-balanced service, where there are many nodes to provide a service, and all the nodes need to be down to propagate the issue to the parent node.
Once you define the algorithm, you need to define the SLA percentage of your service. This is used to display the SLA issue with different colors in the report.
The next step is the trigger definition that will enable Zabbix to know when your service has an issue. Since Zabbix provides a hierarchical view, you can have a service composed of many components, so the intermediate level can avoid a trigger definition that is needed on the lowest level.
The last option is Sort order (0->999). This, of course, doesn't affect the SLA calculation but is only for cosmetic purposes. To visualize a report, for instance, your three levels are sorted in a logical order as the web server, application server, and database server. All that is previously discussed is shown in the following screenshot:
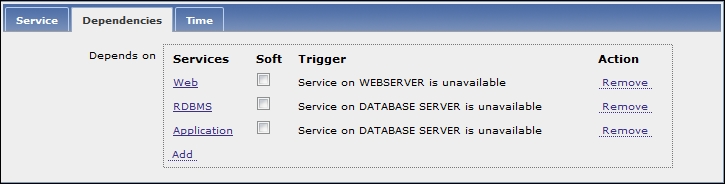
The following screenshot shows the dependencies; here, you don't need to define each one of them because they are defined automatically once you design your hierarchical view. Now, it is possible that one of your services is already defined for a reason in another layer of the service. If this is the case, you only need to mark the service as soft linked by checking the Soft checkbox:
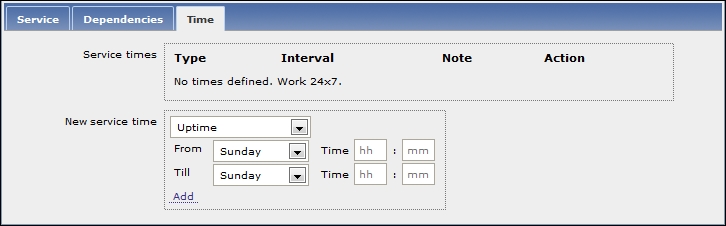
The last tab is used to set the service time. By default, Zabbix considers that a service needs to be available 24 hours a day, for 7 days of the week, and the whole year (24x7x365). Fortunately, for system administrators, not all the services have this requirement. If this is true of you, you can define your Uptime and Downtime periods, as shown in the following screenshot:
Once you have completed the hierarchical definition of your service, the result is available by navigating to Monitoring | IT services.